Estimated Value: $1,409,000 - $1,526,000
2
Beds
3
Baths
1,850
Sq Ft
$794/Sq Ft
Est. Value
About This Home
This home is located at 28 Pier 7, Charlestown, MA 02129 and is currently estimated at $1,469,342, approximately $794 per square foot. 28 Pier 7 is a home located in Suffolk County with nearby schools including Boston Children's School and St John School.
Ownership History
Date
Name
Owned For
Owner Type
Purchase Details
Closed on
Jul 16, 2020
Sold by
Redo Philip
Bought by
Seigal Sheara B and Seigal Jeffrey
Current Estimated Value
Purchase Details
Closed on
Sep 4, 2013
Sold by
Schatz Kathleen A
Bought by
Redo Philip
Home Financials for this Owner
Home Financials are based on the most recent Mortgage that was taken out on this home.
Original Mortgage
$410,000
Interest Rate
4.34%
Mortgage Type
New Conventional
Purchase Details
Closed on
Sep 5, 2003
Sold by
Schatz Kathleen A
Bought by
Hausman Mark and Housman Barbara
Purchase Details
Closed on
Dec 6, 1993
Sold by
New England Liq Rt and Byrne
Bought by
Schatz Kathleen A
Purchase Details
Closed on
Sep 29, 1993
Sold by
Byrne Tr Samuel T and Ne Liquidation Rt
Bought by
Ne Liquidation Rt and Byrne
Create a Home Valuation Report for This Property
The Home Valuation Report is an in-depth analysis detailing your home's value as well as a comparison with similar homes in the area
Home Values in the Area
Average Home Value in this Area
Purchase History
| Date | Buyer | Sale Price | Title Company |
|---|---|---|---|
| Seigal Sheara B | $1,149,000 | None Available | |
| Redo Philip | $837,500 | -- | |
| Redo Philip | $837,500 | -- | |
| Hausman Mark | $40,000 | -- | |
| Schatz Kathleen A | $240,000 | -- | |
| Ne Liquidation Rt | $240,000 | -- |
Source: Public Records
Mortgage History
| Date | Status | Borrower | Loan Amount |
|---|---|---|---|
| Previous Owner | Redo Philip | $410,000 | |
| Previous Owner | Ne Liquidation Rt | $174,000 | |
| Previous Owner | Ne Liquidation Rt | $100,000 | |
| Previous Owner | Ne Liquidation Rt | $200,000 |
Source: Public Records
Tax History Compared to Growth
Tax History
| Year | Tax Paid | Tax Assessment Tax Assessment Total Assessment is a certain percentage of the fair market value that is determined by local assessors to be the total taxable value of land and additions on the property. | Land | Improvement |
|---|---|---|---|---|
| 2025 | $13,317 | $1,150,000 | $0 | $1,150,000 |
| 2024 | $11,583 | $1,062,700 | $0 | $1,062,700 |
| 2023 | $10,870 | $1,012,100 | $0 | $1,012,100 |
| 2022 | $10,795 | $992,200 | $0 | $992,200 |
| 2021 | $10,587 | $992,200 | $0 | $992,200 |
| 2020 | $11,156 | $1,056,400 | $0 | $1,056,400 |
| 2019 | $10,917 | $1,035,800 | $0 | $1,035,800 |
| 2018 | $11,008 | $1,050,400 | $0 | $1,050,400 |
| 2017 | $9,629 | $909,300 | $0 | $909,300 |
| 2016 | $8,912 | $810,200 | $0 | $810,200 |
| 2015 | $11,231 | $927,400 | $0 | $927,400 |
| 2014 | $10,226 | $812,900 | $0 | $812,900 |
Source: Public Records
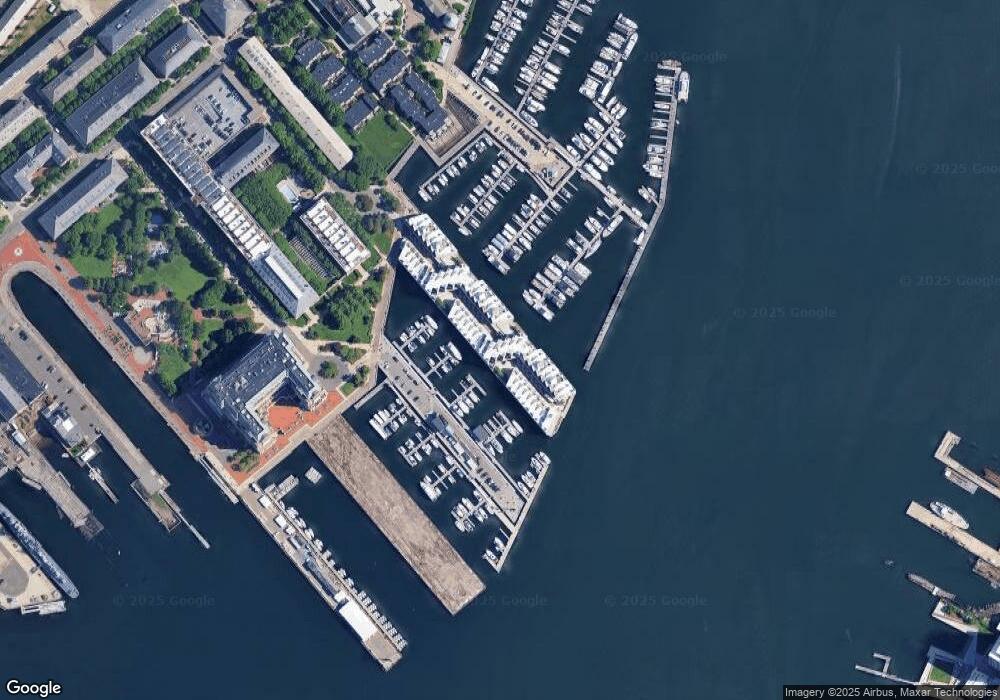
Map
Nearby Homes
- 197 8th St Unit 501
- 197 Eighth St Unit 628
- 197 Eighth St Unit 212
- 42 8th St Unit 5316
- 42 8th St Unit 4209
- 42 8th St Unit 4106
- 42 8th St Unit 1201
- 42 8th St Unit 3306
- 42 8th St Unit 2302
- 106 13th St Unit 204
- 73 Chelsea St Unit 401
- 3 Battery Wharf Unit 3309
- 4 Battery Wharf Unit 4604
- 4 Battery Wharf Unit 4302
- 4 Battery Wharf Unit 4602
- 99 Sumner St Unit 301
- 99 Sumner St Unit 101
- 99 Sumner St Unit 401
- 99 Sumner St Unit 308
- 99 Sumner St Unit 205
- 19 Pier 7 Unit TH
- 27 Pier 7
- 26 Pier 7
- 24 Pier 7
- 19 Pier 7
- 16 Pier 7
- 14 Pier 7
- 6 Pier 7
- 19 Constellation Wharf Unit 19
- 6 Constellation Wharf Unit 6
- 14 Constellation Wharf Unit 14
- 28 Constellation Wharf Unit 28
- 60 Constellation Wharf Unit 60
- 60 Pier 7 Unit 60
- 27 9th St Unit 27
- 27 Constellation Wharf Unit 27
- 24 Constellation Wharf Unit 24
- 26 Constellation Wharf Unit 26
- 66 Constellation Wharf Unit 66
- 31 Pier 7