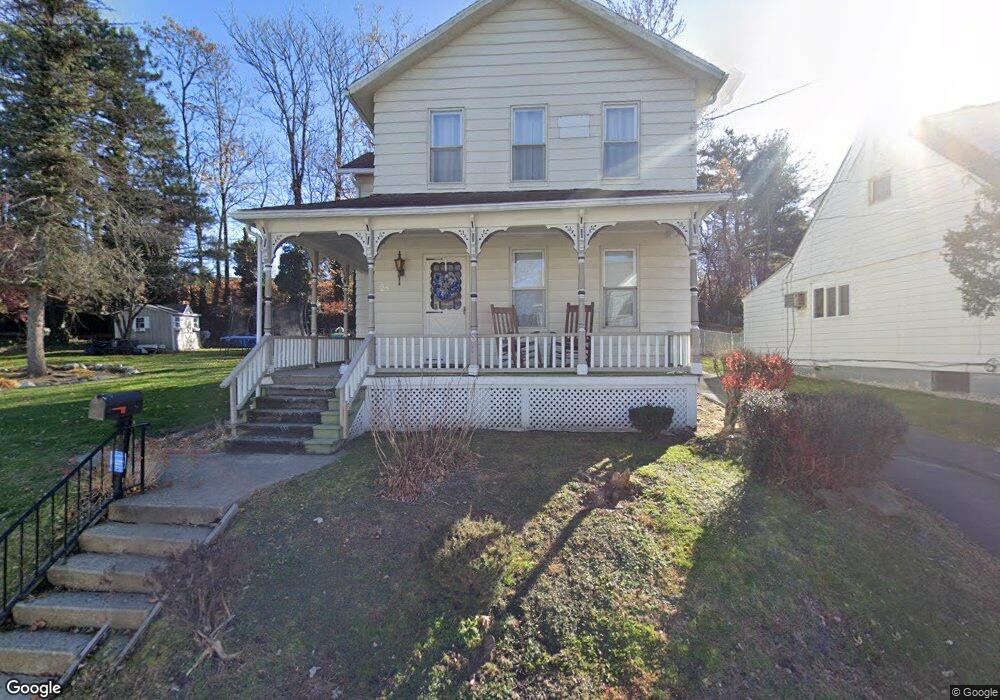
28 Poole St Pittston, PA 18640
Estimated Value: $191,000 - $294,000
3
Beds
2
Baths
1,486
Sq Ft
$148/Sq Ft
Est. Value
About This Home
This home is located at 28 Poole St, Pittston, PA 18640 and is currently estimated at $220,503, approximately $148 per square foot. 28 Poole St is a home located in Luzerne County with nearby schools including Pittston City Intermediate Center, Pittston Area Middle School, and Pittston Area Senior High School.
Ownership History
Date
Name
Owned For
Owner Type
Purchase Details
Closed on
Oct 9, 2014
Sold by
Rinaldi Cheryl A
Bought by
Mcglynn Krista
Current Estimated Value
Home Financials for this Owner
Home Financials are based on the most recent Mortgage that was taken out on this home.
Original Mortgage
$122,735
Outstanding Balance
$94,611
Interest Rate
4.25%
Mortgage Type
FHA
Estimated Equity
$125,892
Purchase Details
Closed on
Oct 26, 2006
Sold by
Celestino Philip C and Celestino Loretta M
Bought by
Rinaldi Cheryl A
Create a Home Valuation Report for This Property
The Home Valuation Report is an in-depth analysis detailing your home's value as well as a comparison with similar homes in the area
Home Values in the Area
Average Home Value in this Area
Purchase History
| Date | Buyer | Sale Price | Title Company |
|---|---|---|---|
| Mcglynn Krista | $125,000 | Fidelity Natl Title Ins Co | |
| Rinaldi Cheryl A | $95,400 | Tiger Abstract Inc |
Source: Public Records
Mortgage History
| Date | Status | Borrower | Loan Amount |
|---|---|---|---|
| Open | Mcglynn Krista | $122,735 |
Source: Public Records
Tax History Compared to Growth
Tax History
| Year | Tax Paid | Tax Assessment Tax Assessment Total Assessment is a certain percentage of the fair market value that is determined by local assessors to be the total taxable value of land and additions on the property. | Land | Improvement |
|---|---|---|---|---|
| 2025 | $2,239 | $90,300 | $35,300 | $55,000 |
| 2024 | $2,203 | $90,300 | $35,300 | $55,000 |
| 2023 | $2,203 | $90,300 | $35,300 | $55,000 |
| 2022 | $2,141 | $90,300 | $35,300 | $55,000 |
| 2021 | $2,119 | $90,300 | $35,300 | $55,000 |
| 2020 | $2,068 | $90,300 | $35,300 | $55,000 |
| 2019 | $2,050 | $90,300 | $35,300 | $55,000 |
| 2018 | $1,983 | $90,300 | $35,300 | $55,000 |
| 2017 | $1,937 | $90,300 | $35,300 | $55,000 |
| 2016 | -- | $90,300 | $35,300 | $55,000 |
| 2015 | $1,521 | $90,300 | $35,300 | $55,000 |
| 2014 | $1,521 | $90,300 | $35,300 | $55,000 |
Source: Public Records
Map
Nearby Homes