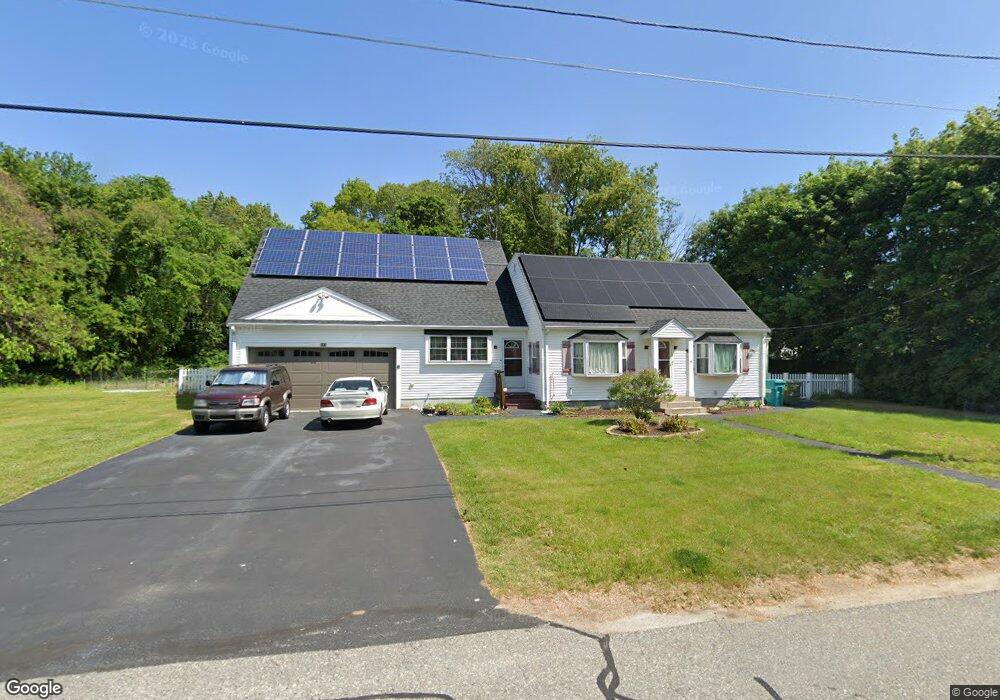
28 Power St Uxbridge, MA 01569
Estimated Value: $475,000 - $594,000
3
Beds
1
Bath
1,320
Sq Ft
$416/Sq Ft
Est. Value
About This Home
This home is located at 28 Power St, Uxbridge, MA 01569 and is currently estimated at $549,322, approximately $416 per square foot. 28 Power St is a home located in Worcester County with nearby schools including Uxbridge High School and Our Lady of the Valley Regional School.
Ownership History
Date
Name
Owned For
Owner Type
Purchase Details
Closed on
Jan 27, 2016
Sold by
Wang Davidson C
Bought by
Wang Davidson C and Wang Anna M
Current Estimated Value
Home Financials for this Owner
Home Financials are based on the most recent Mortgage that was taken out on this home.
Original Mortgage
$187,000
Outstanding Balance
$80,615
Interest Rate
3.97%
Mortgage Type
New Conventional
Estimated Equity
$468,707
Purchase Details
Closed on
Jun 19, 2008
Sold by
Barr David J and Cameron Diane
Bought by
Wang Davidson C
Home Financials for this Owner
Home Financials are based on the most recent Mortgage that was taken out on this home.
Original Mortgage
$213,750
Interest Rate
6.1%
Mortgage Type
Purchase Money Mortgage
Create a Home Valuation Report for This Property
The Home Valuation Report is an in-depth analysis detailing your home's value as well as a comparison with similar homes in the area
Home Values in the Area
Average Home Value in this Area
Purchase History
| Date | Buyer | Sale Price | Title Company |
|---|---|---|---|
| Wang Davidson C | -- | -- | |
| Wang Davidson C | $225,000 | -- |
Source: Public Records
Mortgage History
| Date | Status | Borrower | Loan Amount |
|---|---|---|---|
| Open | Wang Davidson C | $187,000 | |
| Previous Owner | Wang Davidson C | $213,750 |
Source: Public Records
Tax History Compared to Growth
Tax History
| Year | Tax Paid | Tax Assessment Tax Assessment Total Assessment is a certain percentage of the fair market value that is determined by local assessors to be the total taxable value of land and additions on the property. | Land | Improvement |
|---|---|---|---|---|
| 2025 | $6,032 | $460,100 | $141,600 | $318,500 |
| 2024 | $5,659 | $438,000 | $134,300 | $303,700 |
| 2023 | $5,367 | $384,700 | $116,100 | $268,600 |
| 2022 | $5,045 | $332,800 | $101,600 | $231,200 |
| 2021 | $5,091 | $321,800 | $99,500 | $222,300 |
| 2020 | $5,196 | $310,400 | $98,000 | $212,400 |
| 2019 | $5,179 | $298,500 | $98,000 | $200,500 |
| 2018 | $4,705 | $274,000 | $98,000 | $176,000 |
| 2017 | $4,542 | $267,800 | $92,500 | $175,300 |
| 2016 | $4,176 | $237,700 | $77,500 | $160,200 |
| 2015 | $3,303 | $189,800 | $77,500 | $112,300 |
Source: Public Records
Map
Nearby Homes