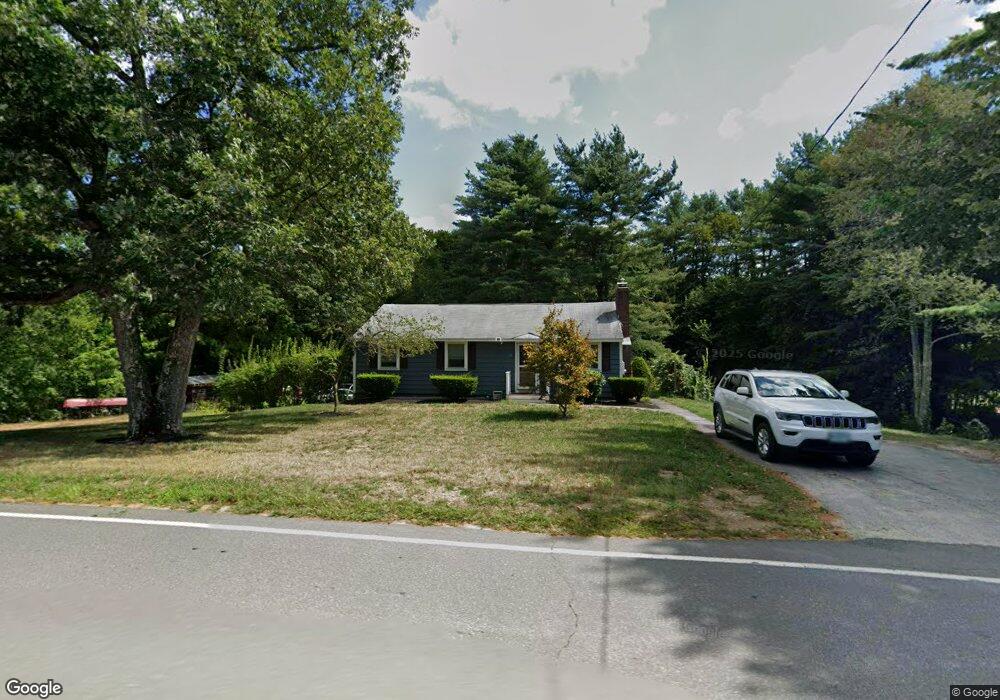
28 S Main St Brookline, NH 03033
Estimated Value: $418,000 - $465,000
3
Beds
1
Bath
1,439
Sq Ft
$308/Sq Ft
Est. Value
About This Home
This home is located at 28 S Main St, Brookline, NH 03033 and is currently estimated at $442,887, approximately $307 per square foot. 28 S Main St is a home with nearby schools including Richard Maghakian Memorial School, Captain Samuel Douglass Academy, and Hollis-Brookline Middle School.
Ownership History
Date
Name
Owned For
Owner Type
Purchase Details
Closed on
Jun 2, 2021
Sold by
Howard-Barnett Patricia A
Bought by
Howard-Barnett Patricia A
Current Estimated Value
Home Financials for this Owner
Home Financials are based on the most recent Mortgage that was taken out on this home.
Original Mortgage
$193,520
Outstanding Balance
$156,475
Interest Rate
2.9%
Mortgage Type
FHA
Estimated Equity
$286,412
Purchase Details
Closed on
Jun 26, 1998
Sold by
Desmarais Richard M and Desmarais Barbara J
Bought by
Howard David M and Howard Patricia A
Home Financials for this Owner
Home Financials are based on the most recent Mortgage that was taken out on this home.
Original Mortgage
$96,000
Interest Rate
7.09%
Create a Home Valuation Report for This Property
The Home Valuation Report is an in-depth analysis detailing your home's value as well as a comparison with similar homes in the area
Home Values in the Area
Average Home Value in this Area
Purchase History
| Date | Buyer | Sale Price | Title Company |
|---|---|---|---|
| Howard-Barnett Patricia A | -- | None Available | |
| Howard-Barnett Patricia A | -- | None Available | |
| Howard David M | $120,000 | -- | |
| Howard David M | $120,000 | -- |
Source: Public Records
Mortgage History
| Date | Status | Borrower | Loan Amount |
|---|---|---|---|
| Open | Howard-Barnett Patricia A | $193,520 | |
| Previous Owner | Howard David M | $246,725 | |
| Previous Owner | Howard David M | $243,079 | |
| Previous Owner | Howard David M | $235,000 | |
| Previous Owner | Howard David M | $96,000 |
Source: Public Records
Tax History Compared to Growth
Tax History
| Year | Tax Paid | Tax Assessment Tax Assessment Total Assessment is a certain percentage of the fair market value that is determined by local assessors to be the total taxable value of land and additions on the property. | Land | Improvement |
|---|---|---|---|---|
| 2024 | $8,345 | $369,100 | $170,100 | $199,000 |
| 2023 | $7,670 | $369,100 | $170,100 | $199,000 |
| 2022 | $6,642 | $223,500 | $98,100 | $125,400 |
| 2021 | $6,388 | $223,500 | $98,100 | $125,400 |
| 2020 | $6,213 | $223,500 | $98,100 | $125,400 |
| 2019 | $6,676 | $223,500 | $98,100 | $125,400 |
| 2018 | $6,607 | $223,500 | $98,100 | $125,400 |
| 2017 | $5,995 | $182,000 | $80,100 | $101,900 |
| 2016 | $5,926 | $182,000 | $80,100 | $101,900 |
| 2015 | $5,651 | $182,000 | $80,100 | $101,900 |
| 2014 | $5,979 | $182,000 | $80,100 | $101,900 |
| 2013 | $5,757 | $182,000 | $80,100 | $101,900 |
Source: Public Records
Map
Nearby Homes
- 46 Oak Hill Rd
- 55 Oak Hill Rd
- 6 Flint Meadow Dr
- 22 Hobart Hill Rd
- 6 High Oaks Path
- 7 Winterberry Rd
- 9 Winterberry Rd
- 28A Rocky Pond Rd
- 167 Route 13
- 364 Townsend Hill Rd
- 15 N End Rd
- 5 Carons Way
- 21 Cranberry St
- 22 Austin Ln
- 93 Old Milford Rd
- 143 Worcester Rd
- 179 Brookline St
- 0 Brookline St
- 64 Meadow Rd
- 10 Boynton St
- 37 S Main St
- 35 S Main St
- 30 S Main St
- 31 S Main St
- 24 S Main St
- 32 So Main St
- 55 Route 13
- 55 Route 13
- 14 Stickney Brook Rd
- 12 Stickney Brook Rd
- 6 Stickney Brook Rd
- 65 Route 13
- 39 S Main St
- 5 Stickney Brook Rd
- 11 Stickney Brook Rd
- 32 S Main St
- 9 Stickney Brook Rd
- 7 Stickney Brook Rd
- 66 Route 13
- 20 S Main St