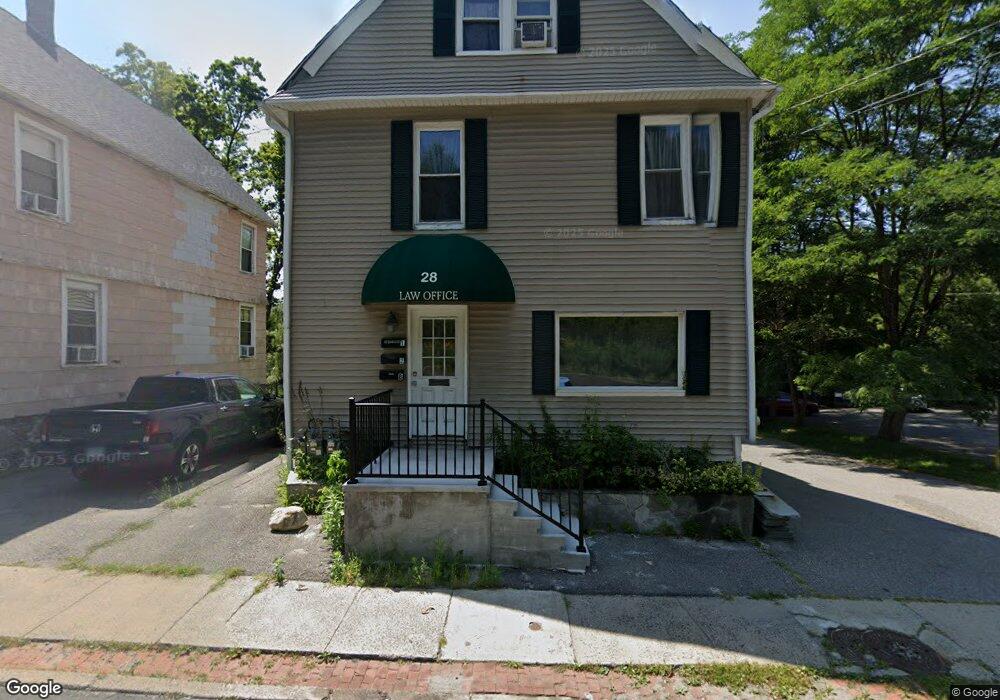
28 S Main St Winsted, CT 06098
Estimated Value: $171,000 - $340,000
5
Beds
3
Baths
1,622
Sq Ft
$154/Sq Ft
Est. Value
About This Home
This home is located at 28 S Main St, Winsted, CT 06098 and is currently estimated at $249,880, approximately $154 per square foot. 28 S Main St is a home located in Litchfield County with nearby schools including Explorations Charter School.
Ownership History
Date
Name
Owned For
Owner Type
Purchase Details
Closed on
Mar 14, 2011
Sold by
Dicrosta Bartolomeo and Dicrosta Holly
Bought by
Icebox Investments Llc
Current Estimated Value
Purchase Details
Closed on
Sep 26, 2006
Sold by
Tialogan Llc
Bought by
Boden Jason M and Boden Nichole L
Home Financials for this Owner
Home Financials are based on the most recent Mortgage that was taken out on this home.
Original Mortgage
$128,000
Interest Rate
6.59%
Mortgage Type
Commercial
Purchase Details
Closed on
Apr 25, 2003
Sold by
Fcb Properties
Bought by
Doran Llc
Create a Home Valuation Report for This Property
The Home Valuation Report is an in-depth analysis detailing your home's value as well as a comparison with similar homes in the area
Home Values in the Area
Average Home Value in this Area
Purchase History
| Date | Buyer | Sale Price | Title Company |
|---|---|---|---|
| Icebox Investments Llc | $105,000 | -- | |
| Icebox Investments Llc | $105,000 | -- | |
| Boden Jason M | $160,000 | -- | |
| Boden Jason M | $160,000 | -- | |
| Doran Llc | $40,000 | -- | |
| Doran Llc | $40,000 | -- |
Source: Public Records
Mortgage History
| Date | Status | Borrower | Loan Amount |
|---|---|---|---|
| Previous Owner | Doran Llc | $128,000 | |
| Previous Owner | Doran Llc | $3,825 |
Source: Public Records
Tax History Compared to Growth
Tax History
| Year | Tax Paid | Tax Assessment Tax Assessment Total Assessment is a certain percentage of the fair market value that is determined by local assessors to be the total taxable value of land and additions on the property. | Land | Improvement |
|---|---|---|---|---|
| 2025 | $3,300 | $113,120 | $21,070 | $92,050 |
| 2024 | $3,081 | $113,120 | $41,230 | $71,890 |
| 2023 | $2,985 | $113,120 | $41,230 | $71,890 |
| 2022 | $3,148 | $93,870 | $36,820 | $57,050 |
| 2021 | $3,148 | $93,870 | $36,820 | $57,050 |
| 2020 | $3,148 | $93,870 | $36,820 | $57,050 |
| 2019 | $3,148 | $93,870 | $36,820 | $57,050 |
| 2018 | $3,148 | $93,870 | $36,820 | $57,050 |
| 2017 | $3,855 | $114,940 | $55,160 | $59,780 |
| 2016 | $3,062 | $91,280 | $31,500 | $59,780 |
| 2015 | $2,985 | $91,280 | $31,500 | $59,780 |
| 2014 | $2,913 | $91,280 | $31,500 | $59,780 |
Source: Public Records
Map
Nearby Homes
- 30 S Main St
- 32 S Main St
- 11 Strong Terrace
- 36 S Main St
- 17 Strong Terrace
- 44 S Main St
- 38 S Main St
- 8 S Main St
- 8 S Main St
- 5 Strong Terrace
- 7 Strong Terrace
- 18 Strong Terrace
- 24 Strong Terrace
- 35 Strong Terrace
- 32 Strong Terrace
- 115 S Main St
- 100 Strong Terrace
- 42 Strong Terrace
- 94 Strong Terrace
- 51 Strong Terrace