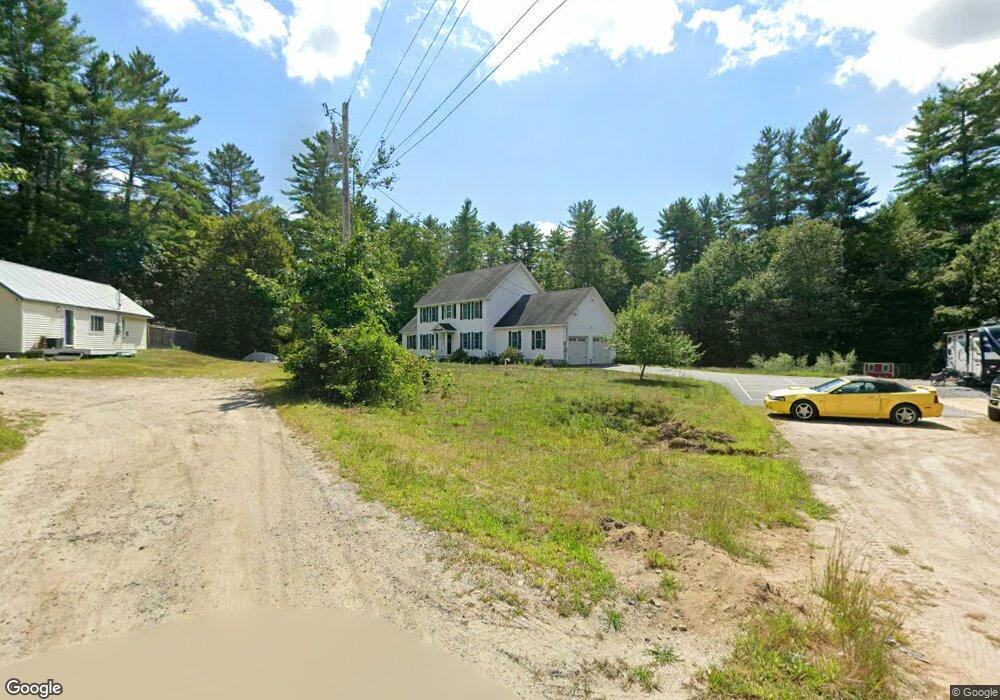
28 Sargent Rd Brookline, NH 03033
Estimated Value: $709,000 - $743,000
4
Beds
3
Baths
3,401
Sq Ft
$214/Sq Ft
Est. Value
About This Home
This home is located at 28 Sargent Rd, Brookline, NH 03033 and is currently estimated at $728,816, approximately $214 per square foot. 28 Sargent Rd is a home with nearby schools including Richard Maghakian Memorial School, Captain Samuel Douglass Academy, and Hollis-Brookline Middle School.
Ownership History
Date
Name
Owned For
Owner Type
Purchase Details
Closed on
Sep 12, 2025
Sold by
Loura Rui and Loura Diana
Bought by
R D Loura Ret and Loura
Current Estimated Value
Purchase Details
Closed on
Aug 1, 2013
Sold by
Pico Line Const Inc
Bought by
Loura Rui and Loura Diana
Home Financials for this Owner
Home Financials are based on the most recent Mortgage that was taken out on this home.
Original Mortgage
$224,000
Interest Rate
3.45%
Mortgage Type
Stand Alone Refi Refinance Of Original Loan
Purchase Details
Closed on
Jul 19, 2012
Sold by
Adamyk Homes Inc
Bought by
Pico Line Constr Inc
Create a Home Valuation Report for This Property
The Home Valuation Report is an in-depth analysis detailing your home's value as well as a comparison with similar homes in the area
Home Values in the Area
Average Home Value in this Area
Purchase History
| Date | Buyer | Sale Price | Title Company |
|---|---|---|---|
| R D Loura Ret | -- | -- | |
| Loura Rui | $320,800 | -- | |
| Loura Rui | $320,800 | -- | |
| Pico Line Constr Inc | $87,500 | -- | |
| Pico Line Constr Inc | $87,500 | -- |
Source: Public Records
Mortgage History
| Date | Status | Borrower | Loan Amount |
|---|---|---|---|
| Previous Owner | Pico Line Constr Inc | $224,000 | |
| Closed | Pico Line Constr Inc | $0 |
Source: Public Records
Tax History Compared to Growth
Tax History
| Year | Tax Paid | Tax Assessment Tax Assessment Total Assessment is a certain percentage of the fair market value that is determined by local assessors to be the total taxable value of land and additions on the property. | Land | Improvement |
|---|---|---|---|---|
| 2024 | $14,620 | $646,600 | $186,900 | $459,700 |
| 2023 | $13,436 | $646,600 | $186,900 | $459,700 |
| 2022 | $11,621 | $391,000 | $109,200 | $281,800 |
| 2021 | $11,175 | $391,000 | $109,200 | $281,800 |
| 2020 | $10,870 | $391,000 | $109,200 | $281,800 |
| 2019 | $11,679 | $391,000 | $109,200 | $281,800 |
| 2018 | $11,558 | $391,000 | $109,200 | $281,800 |
| 2017 | $11,160 | $338,800 | $103,600 | $235,200 |
| 2016 | $11,031 | $338,800 | $103,600 | $235,200 |
| 2015 | $10,520 | $338,800 | $103,600 | $235,200 |
| 2014 | $11,130 | $338,800 | $103,600 | $235,200 |
| 2013 | $3,384 | $107,000 | $107,000 | $0 |
Source: Public Records
Map
Nearby Homes
- 6 Flint Meadow Dr
- 46 Oak Hill Rd
- 22 Hobart Hill Rd
- 55 Oak Hill Rd
- 28A Rocky Pond Rd
- 5 Carons Way
- 167 Route 13
- 6 High Oaks Path
- 22 Austin Ln
- 7 Winterberry Rd
- 9 Winterberry Rd
- 93 Old Milford Rd
- 143 Worcester Rd
- 179 Brookline St
- 21 Cranberry St
- 364 Townsend Hill Rd
- 15 N End Rd
- 10 Boynton St
- 3 Wood Ln
- 172 Hayden Rd