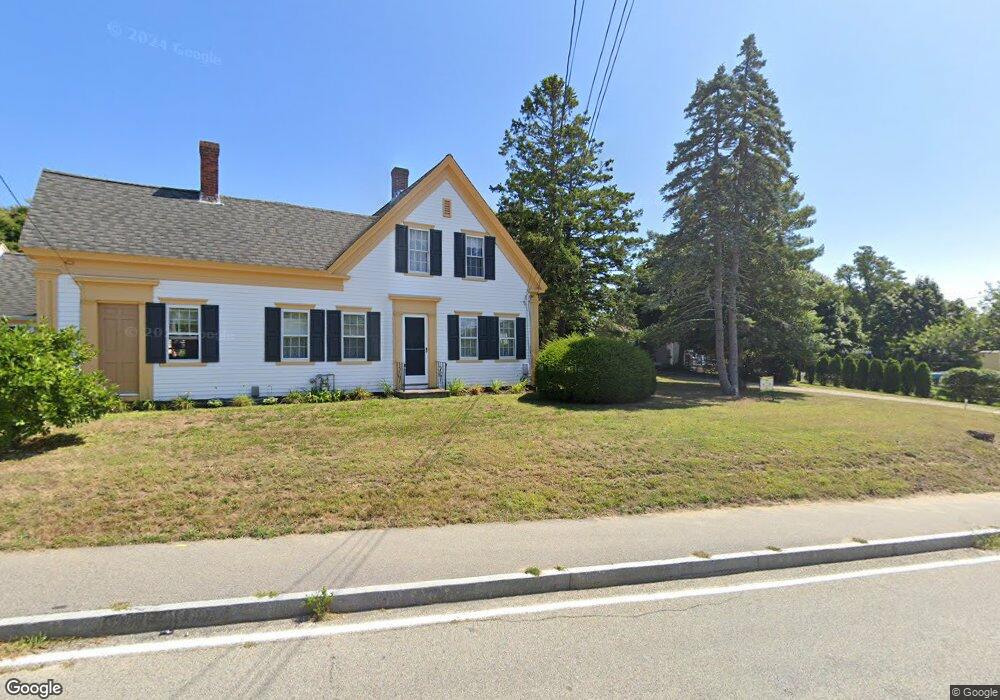
28 South St Dennis Port, MA 02639
Dennis Port NeighborhoodEstimated Value: $735,000 - $1,535,000
6
Beds
5
Baths
3,009
Sq Ft
$420/Sq Ft
Est. Value
About This Home
This home is located at 28 South St, Dennis Port, MA 02639 and is currently estimated at $1,262,738, approximately $419 per square foot. 28 South St is a home located in Barnstable County with nearby schools including Dennis-Yarmouth Regional High School and St. Pius X. School.
Ownership History
Date
Name
Owned For
Owner Type
Purchase Details
Closed on
Jul 10, 2002
Sold by
Keith Thomas A and Keith Mary Ann
Bought by
Foley L Christopher L and Foley Susan W
Current Estimated Value
Home Financials for this Owner
Home Financials are based on the most recent Mortgage that was taken out on this home.
Original Mortgage
$550,000
Outstanding Balance
$234,478
Interest Rate
6.79%
Mortgage Type
Purchase Money Mortgage
Estimated Equity
$1,028,260
Purchase Details
Closed on
Jun 2, 1997
Sold by
Wilcox Paul and Wilcox Elizabeth G
Bought by
Keith Thomas A and Keith Maryann
Create a Home Valuation Report for This Property
The Home Valuation Report is an in-depth analysis detailing your home's value as well as a comparison with similar homes in the area
Home Values in the Area
Average Home Value in this Area
Purchase History
| Date | Buyer | Sale Price | Title Company |
|---|---|---|---|
| Foley L Christopher L | $800,000 | -- | |
| Foley L Christopher L | $800,000 | -- | |
| Keith Thomas A | $238,500 | -- | |
| Keith Thomas A | $238,500 | -- |
Source: Public Records
Mortgage History
| Date | Status | Borrower | Loan Amount |
|---|---|---|---|
| Open | Keith Thomas A | $280,000 | |
| Open | Keith Thomas A | $550,000 | |
| Closed | Keith Thomas A | $550,000 |
Source: Public Records
Tax History Compared to Growth
Tax History
| Year | Tax Paid | Tax Assessment Tax Assessment Total Assessment is a certain percentage of the fair market value that is determined by local assessors to be the total taxable value of land and additions on the property. | Land | Improvement |
|---|---|---|---|---|
| 2025 | $5,109 | $1,180,000 | $497,500 | $682,500 |
| 2024 | $4,812 | $1,096,100 | $478,500 | $617,600 |
| 2023 | $4,660 | $997,800 | $435,000 | $562,800 |
| 2022 | $4,609 | $823,000 | $391,800 | $431,200 |
| 2021 | $4,911 | $814,500 | $384,100 | $430,400 |
| 2020 | $5,272 | $864,300 | $430,200 | $434,100 |
| 2019 | $5,356 | $868,000 | $421,800 | $446,200 |
| 2018 | $5,076 | $800,700 | $430,200 | $370,500 |
| 2017 | $4,613 | $750,100 | $366,500 | $383,600 |
| 2016 | $4,672 | $715,400 | $399,200 | $316,200 |
| 2015 | $4,579 | $715,400 | $399,200 | $316,200 |
| 2014 | $4,192 | $660,200 | $399,200 | $261,000 |
Source: Public Records
Map
Nearby Homes
- 47 Telegraph Rd Unit 1
- 10 Candlewood Ln Unit 2-1
- 12 Candlewood Ln Unit 2-9
- 9 Country Ln
- 73 Division St
- 12 Cross St
- 141 Division St
- 141 Division St
- 148 Belmont Rd
- 104 Toms Path
- 40 Willow St
- 104 Toms Path
- 45 Route 28
- 79 Massachusetts 28
- 9 Bells Neck Rd Unit 10
- 268 Main St
- 78 Upper County Rd Unit A&B
- 78 Upper County Rd
- 6 Bayberry Ln
- 3 Fairbanks Dr
- 11 South St
- 8 South St
- 8 South St Unit 1
- 14 South St
- 613 Main St
- 90 South St
- 78 South St
- 10 South St Unit 2-8
- 10 South St Unit 2-7
- 10 South St Unit 2-6
- 10 South St Unit 2-5
- 10 South St Unit 2-4
- 10 South St Unit 2-3
- 10 South St Unit 2-2
- 10 South St Unit 1-8
- 10 South St Unit 1-7
- 10 South St Unit 1-6
- 10 South St Unit 1-5
- 10 South St Unit 1-4
- 10 South St Unit 1-3