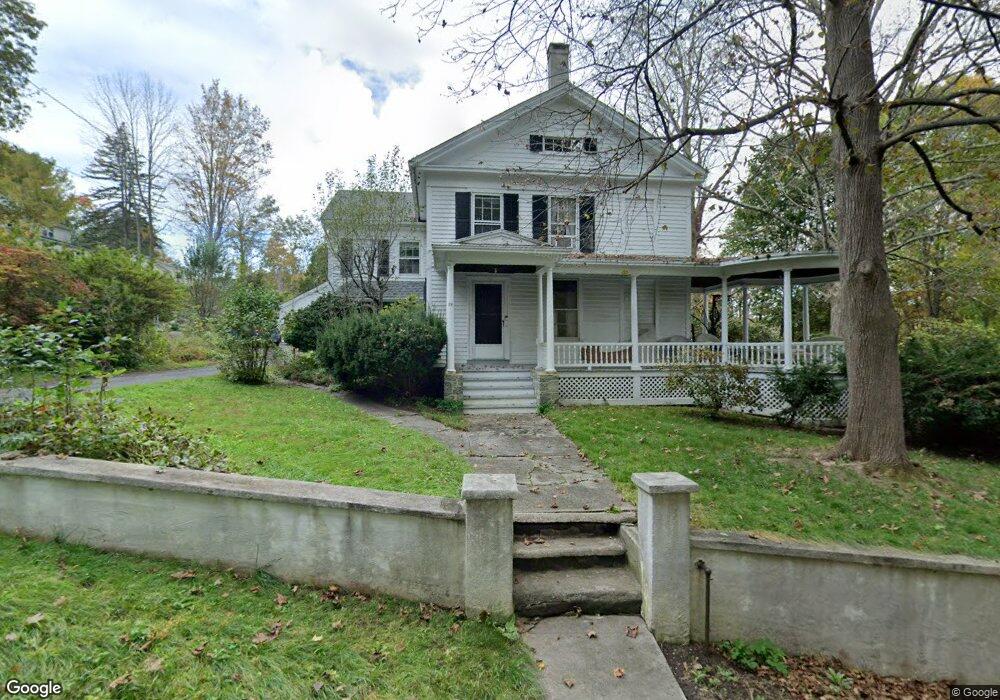
28 Spring St Winsted, CT 06098
Estimated Value: $261,000 - $395,000
5
Beds
2
Baths
2,676
Sq Ft
$123/Sq Ft
Est. Value
About This Home
This home is located at 28 Spring St, Winsted, CT 06098 and is currently estimated at $330,372, approximately $123 per square foot. 28 Spring St is a home located in Litchfield County with nearby schools including Pearson School, Explorations Charter School, and St Anthony School.
Ownership History
Date
Name
Owned For
Owner Type
Purchase Details
Closed on
Dec 4, 2025
Sold by
Cannavo Joseph A Est and Cannavo
Bought by
Landini Aaron G
Current Estimated Value
Purchase Details
Closed on
Feb 5, 2019
Sold by
Cannavo Joseph S Est and Cannavo
Bought by
Cannavo Joseph A
Home Financials for this Owner
Home Financials are based on the most recent Mortgage that was taken out on this home.
Original Mortgage
$130,300
Interest Rate
4.5%
Mortgage Type
New Conventional
Create a Home Valuation Report for This Property
The Home Valuation Report is an in-depth analysis detailing your home's value as well as a comparison with similar homes in the area
Home Values in the Area
Average Home Value in this Area
Purchase History
| Date | Buyer | Sale Price | Title Company |
|---|---|---|---|
| Landini Aaron G | $260,000 | -- | |
| Cannavo Joseph A | $162,875 | -- | |
| Cannavo Joseph A | $162,875 | -- |
Source: Public Records
Mortgage History
| Date | Status | Borrower | Loan Amount |
|---|---|---|---|
| Previous Owner | Cannavo Joseph A | $130,300 |
Source: Public Records
Tax History
| Year | Tax Paid | Tax Assessment Tax Assessment Total Assessment is a certain percentage of the fair market value that is determined by local assessors to be the total taxable value of land and additions on the property. | Land | Improvement |
|---|---|---|---|---|
| 2025 | $6,673 | $228,760 | $31,850 | $196,910 |
| 2024 | $6,231 | $228,760 | $31,850 | $196,910 |
| 2023 | $6,037 | $228,760 | $31,850 | $196,910 |
| 2022 | $5,196 | $154,910 | $24,150 | $130,760 |
| 2021 | $5,196 | $154,910 | $24,150 | $130,760 |
| 2020 | $5,196 | $154,910 | $24,150 | $130,760 |
| 2019 | $5,196 | $154,910 | $24,150 | $130,760 |
| 2018 | $5,196 | $154,910 | $24,150 | $130,760 |
| 2017 | $5,095 | $151,900 | $24,150 | $127,750 |
| 2016 | $5,095 | $151,900 | $24,150 | $127,750 |
| 2015 | $4,967 | $151,900 | $24,150 | $127,750 |
| 2014 | $4,847 | $151,900 | $24,150 | $127,750 |
Source: Public Records
Map
Nearby Homes
- 201 Rockwell St
- 187 Rockwell St
- 187 Rockwell St
- 209 1/2 Rockwell St
- 21 Spring St
- 21 Spring St
- 209 Rockwell St
- 213 Rockwell St
- 214 Rockwell St
- 140 Ridge St
- 15 Spring St
- 136 Ridge St
- 144 Ridge St
- 218 Rockwell St
- 132 Ridge St
- 157 Prospect St
- 220 Rockwell St
- 25 Superior St
- 128 Ridge St
- 217 Rockwell St Unit 219
Your Personal Tour Guide
Ask me questions while you tour the home.