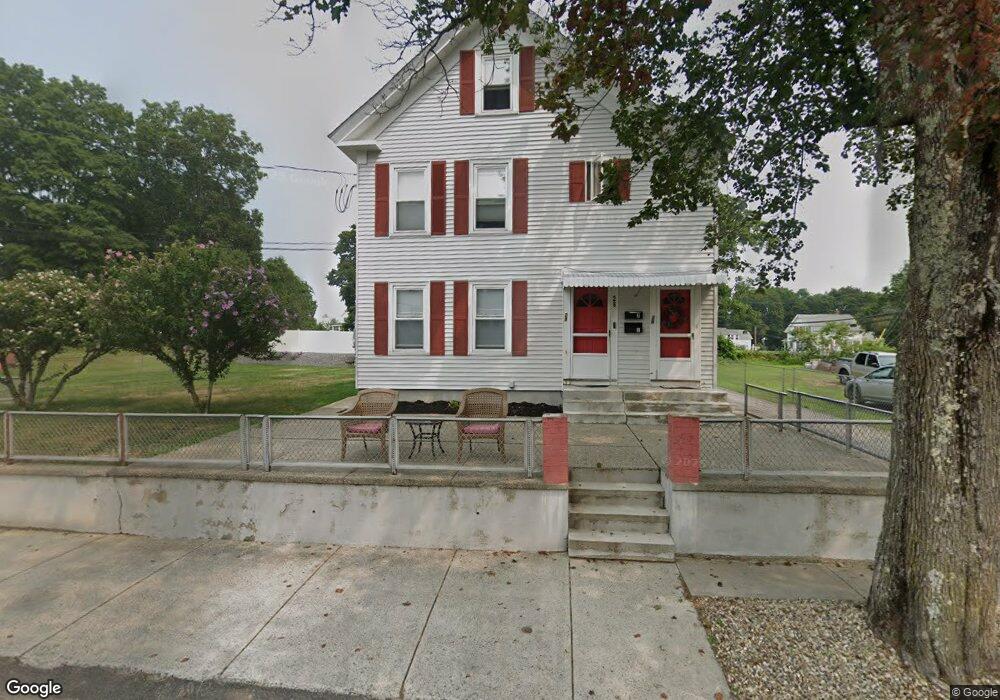
28 Summer St Hudson, MA 01749
Downtown Hudson NeighborhoodEstimated Value: $468,000 - $671,072
4
Beds
2
Baths
2,280
Sq Ft
$240/Sq Ft
Est. Value
About This Home
This home is located at 28 Summer St, Hudson, MA 01749 and is currently estimated at $548,018, approximately $240 per square foot. 28 Summer St is a home located in Middlesex County with nearby schools including David J. Quinn Middle School, Hudson High School, and First Steps Children's Center.
Ownership History
Date
Name
Owned For
Owner Type
Purchase Details
Closed on
Oct 31, 2018
Sold by
54 Webster Ret
Bought by
Winchester Dev Group 2
Current Estimated Value
Home Financials for this Owner
Home Financials are based on the most recent Mortgage that was taken out on this home.
Original Mortgage
$701,250
Outstanding Balance
$614,074
Interest Rate
4.6%
Mortgage Type
Purchase Money Mortgage
Estimated Equity
-$66,056
Create a Home Valuation Report for This Property
The Home Valuation Report is an in-depth analysis detailing your home's value as well as a comparison with similar homes in the area
Home Values in the Area
Average Home Value in this Area
Purchase History
| Date | Buyer | Sale Price | Title Company |
|---|---|---|---|
| Winchester Dev Group 2 | $935,000 | -- |
Source: Public Records
Mortgage History
| Date | Status | Borrower | Loan Amount |
|---|---|---|---|
| Open | Winchester Dev Group 2 | $701,250 |
Source: Public Records
Tax History Compared to Growth
Tax History
| Year | Tax Paid | Tax Assessment Tax Assessment Total Assessment is a certain percentage of the fair market value that is determined by local assessors to be the total taxable value of land and additions on the property. | Land | Improvement |
|---|---|---|---|---|
| 2025 | $6,536 | $470,900 | $169,700 | $301,200 |
| 2024 | $6,079 | $434,200 | $154,200 | $280,000 |
| 2023 | $6,253 | $428,300 | $148,300 | $280,000 |
| 2022 | $5,461 | $344,300 | $134,800 | $209,500 |
| 2021 | $5,191 | $312,900 | $128,400 | $184,500 |
| 2020 | $4,897 | $294,800 | $125,900 | $168,900 |
| 2019 | $4,949 | $290,600 | $125,900 | $164,700 |
| 2018 | $4,856 | $277,500 | $119,900 | $157,600 |
| 2017 | $4,384 | $250,500 | $114,100 | $136,400 |
| 2016 | $3,914 | $226,400 | $114,100 | $112,300 |
| 2015 | $3,929 | $227,500 | $114,100 | $113,400 |
| 2014 | $3,751 | $215,300 | $100,100 | $115,200 |
Source: Public Records
Map
Nearby Homes
- 11 Barracks Rd Unit 11
- 9 Barracks Rd Unit 9
- 3 Barracks Rd Unit 3
- 7 Barracks Rd Unit 7
- 5 Barracks Rd Unit 5
- 34 Forest Ave
- 248 Main St Unit 207
- 248 Main St Unit 216
- 16 Houghton St
- 56 Forest Ave
- 65 Main St
- 17 School St Unit C
- 17 School St Unit A
- 18-24 River St Unit 1
- 107 Washington St
- 56 Park St
- 4 Linden St
- 26 Marychris Dr
- 74 Cox St Unit 9
- 425 Main St Unit 11B
- 24 Summer St
- 41 Grove St
- 25 Summer St
- 20 Summer St
- 20 Summer St Unit Summer St
- 20 Summer St Unit 20 Summer St U 2
- 20 Summer St Unit 1
- 20 Summer St Unit 2
- 20-2 Summer St Unit 2
- 29 Grove St
- 29 Grove St Unit B
- 29 Grove St
- 29 Grove St Unit 3
- 29 Grove St Unit C
- 29 Grove St Unit 2
- 29 Grove St Unit 1
- 23 Summer St
- 29 Summer St
- 10 Spring St
- 10 Spring St Unit A