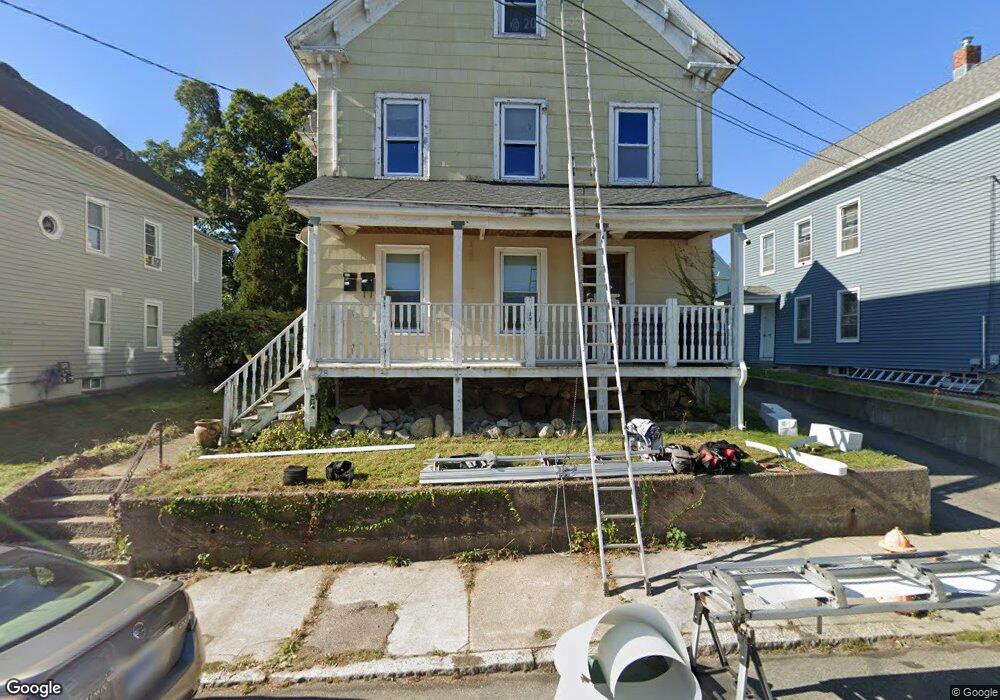
28 Summer St New London, CT 06320
Jefferson NeighborhoodEstimated Value: $330,944 - $358,000
6
Beds
3
Baths
3,120
Sq Ft
$110/Sq Ft
Est. Value
About This Home
This home is located at 28 Summer St, New London, CT 06320 and is currently estimated at $342,486, approximately $109 per square foot. 28 Summer St is a home located in New London County with nearby schools including Harbor Elementary School, Bennie Dover Jackson Middle School, and New London High School.
Ownership History
Date
Name
Owned For
Owner Type
Purchase Details
Closed on
Sep 23, 2010
Sold by
Fnma
Bought by
Burnett Daniel
Current Estimated Value
Purchase Details
Closed on
Nov 3, 2009
Sold by
National City Bk
Bought by
Federal National Mortgage Association
Purchase Details
Closed on
Jul 30, 2004
Sold by
Fellows Darius
Bought by
Elam Denia
Purchase Details
Closed on
May 15, 1996
Sold by
Watterson Josephine T
Bought by
Fellows Darius P
Create a Home Valuation Report for This Property
The Home Valuation Report is an in-depth analysis detailing your home's value as well as a comparison with similar homes in the area
Home Values in the Area
Average Home Value in this Area
Purchase History
| Date | Buyer | Sale Price | Title Company |
|---|---|---|---|
| Burnett Daniel | -- | -- | |
| Burnett Daniel | -- | -- | |
| Federal National Mortgage Association | -- | -- | |
| National City Mtg | -- | -- | |
| Federal National Mortgage Association | -- | -- | |
| Elam Denia | $175,000 | -- | |
| Elam Denia | $175,000 | -- | |
| Fellows Darius P | $28,000 | -- | |
| Fellows Darius P | $28,000 | -- |
Source: Public Records
Mortgage History
| Date | Status | Borrower | Loan Amount |
|---|---|---|---|
| Open | Fellows Darius P | $33,890 | |
| Previous Owner | Fellows Darius P | $239,000 |
Source: Public Records
Tax History Compared to Growth
Tax History
| Year | Tax Paid | Tax Assessment Tax Assessment Total Assessment is a certain percentage of the fair market value that is determined by local assessors to be the total taxable value of land and additions on the property. | Land | Improvement |
|---|---|---|---|---|
| 2025 | $4,368 | $160,600 | $40,400 | $120,200 |
| 2024 | $4,417 | $160,600 | $40,400 | $120,200 |
| 2023 | $4,014 | $107,800 | $32,270 | $75,530 |
| 2022 | $4,022 | $107,800 | $32,270 | $75,530 |
| 2021 | $4,091 | $107,800 | $32,270 | $75,530 |
| 2020 | $4,117 | $107,800 | $32,270 | $75,530 |
| 2019 | $4,301 | $107,800 | $32,270 | $75,530 |
| 2018 | $4,002 | $91,490 | $31,010 | $60,480 |
| 2017 | $4,049 | $91,490 | $31,010 | $60,480 |
| 2016 | $3,702 | $91,490 | $31,010 | $60,480 |
| 2015 | $3,613 | $91,490 | $31,010 | $60,480 |
| 2014 | $3,135 | $91,490 | $31,010 | $60,480 |
Source: Public Records
Map
Nearby Homes
- 26 Jefferson Ave
- 835 Bank St
- 77 Colman St
- 49 Belden St
- 55 Connecticut Ave
- 59 Connecticut Ave
- 38 Mountain Ave
- 2 Faye St
- 32 Moore Ave
- 18 W Pleasant St
- 142 Montauk Ave
- 152 Blydenburg Ave
- 2 Coit St Unit 1
- 9 Brewer St Unit 3
- 9 Brewer St Unit 1
- 9 Brewer St Unit 2
- 9 Brewer St
- 400 Bank St Unit 105
- 35 Pine St
- 72 Willetts Ave