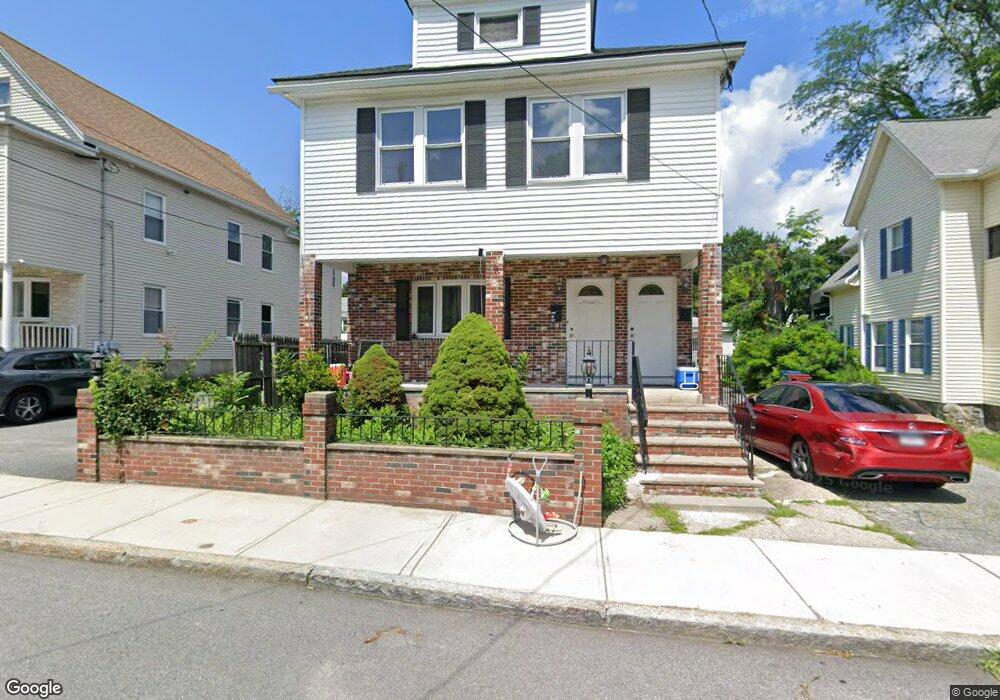
28 Sycamore St Lowell, MA 01852
Belvidere NeighborhoodEstimated Value: $684,511 - $798,000
5
Beds
2
Baths
2,547
Sq Ft
$290/Sq Ft
Est. Value
About This Home
This home is located at 28 Sycamore St, Lowell, MA 01852 and is currently estimated at $739,628, approximately $290 per square foot. 28 Sycamore St is a home located in Middlesex County with nearby schools including Moody Elementary School, Abraham Lincoln Elementary School, and Greenhalge Elementary School.
Ownership History
Date
Name
Owned For
Owner Type
Purchase Details
Closed on
Apr 30, 2003
Sold by
Cavaleiro Alessandra and Ormonde Alessandra
Bought by
Cavaleiro Alessandra and Cavaleiro Michael D
Current Estimated Value
Home Financials for this Owner
Home Financials are based on the most recent Mortgage that was taken out on this home.
Original Mortgage
$52,700
Outstanding Balance
$22,556
Interest Rate
5.82%
Mortgage Type
Purchase Money Mortgage
Estimated Equity
$717,072
Purchase Details
Closed on
May 16, 1997
Sold by
Suelke Rt and Zuelke Laurence W
Bought by
Cavaleiro Michael D and Ormonde Allesandra
Home Financials for this Owner
Home Financials are based on the most recent Mortgage that was taken out on this home.
Original Mortgage
$60,000
Interest Rate
8.12%
Mortgage Type
Purchase Money Mortgage
Create a Home Valuation Report for This Property
The Home Valuation Report is an in-depth analysis detailing your home's value as well as a comparison with similar homes in the area
Home Values in the Area
Average Home Value in this Area
Purchase History
| Date | Buyer | Sale Price | Title Company |
|---|---|---|---|
| Cavaleiro Alessandra | -- | -- | |
| Cavaleiro Alessandra | -- | -- | |
| Cavaleiro Alessandra | -- | -- | |
| Cavaleiro Michael D | $90,000 | -- | |
| Cavaleiro Michael D | $90,000 | -- |
Source: Public Records
Mortgage History
| Date | Status | Borrower | Loan Amount |
|---|---|---|---|
| Open | Cavaleiro Alessandra | $52,700 | |
| Closed | Cavaleiro Michael D | $52,700 | |
| Previous Owner | Cavaleiro Michael D | $60,000 |
Source: Public Records
Tax History
| Year | Tax Paid | Tax Assessment Tax Assessment Total Assessment is a certain percentage of the fair market value that is determined by local assessors to be the total taxable value of land and additions on the property. | Land | Improvement |
|---|---|---|---|---|
| 2025 | $7,361 | $641,200 | $191,100 | $450,100 |
| 2024 | $6,871 | $576,900 | $178,600 | $398,300 |
| 2023 | $6,380 | $513,700 | $155,300 | $358,400 |
| 2022 | $5,911 | $465,800 | $141,200 | $324,600 |
| 2021 | $5,486 | $407,600 | $122,800 | $284,800 |
| 2020 | $5,153 | $385,700 | $122,800 | $262,900 |
| 2019 | $4,959 | $353,200 | $122,100 | $231,100 |
| 2018 | $4,658 | $323,700 | $116,300 | $207,400 |
| 2017 | $4,440 | $297,600 | $107,900 | $189,700 |
| 2016 | $4,381 | $289,000 | $99,300 | $189,700 |
| 2015 | $4,107 | $265,300 | $99,300 | $166,000 |
| 2013 | $3,757 | $250,300 | $109,600 | $140,700 |
Source: Public Records
Map
Nearby Homes
- 471 Butman Rd
- 313 Nesmith St
- 200 Rogers St Unit 6
- 44 Hanks St
- 234 Nesmith St Unit 8
- 42 Pentucket Ave
- 810 Lawrence St Unit C
- 1204 Lawrence St
- 900 Lawrence St Unit 5
- 251 Clark Rd
- 14 Warnock St
- 5 Lenox St Unit 2
- 5 Lenox St Unit 4
- 21 Agawam St
- 74 Felton St Unit A
- 36 Crowley St
- 45 Clark Rd
- 31 Merrill St
- 88 Perry St
- 85 Kinsman St
Your Personal Tour Guide
Ask me questions while you tour the home.