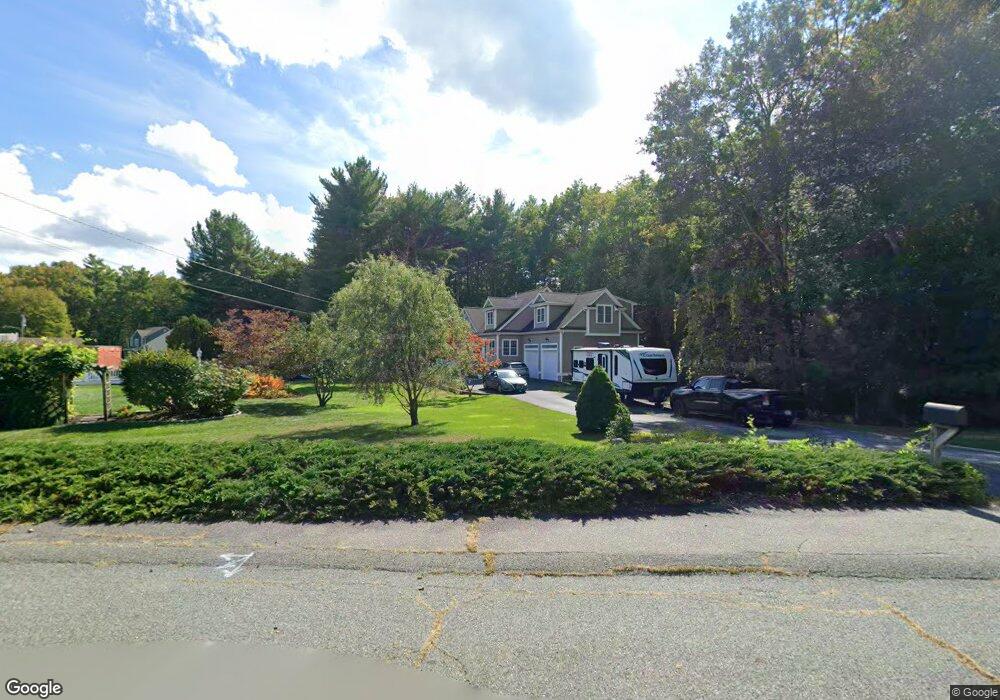
28 Thunder Rd Taunton, MA 02780
Oakland NeighborhoodEstimated Value: $605,000 - $637,964
3
Beds
3
Baths
1,938
Sq Ft
$322/Sq Ft
Est. Value
About This Home
This home is located at 28 Thunder Rd, Taunton, MA 02780 and is currently estimated at $623,741, approximately $321 per square foot. 28 Thunder Rd is a home located in Bristol County with nearby schools including Benjamin Friedman Middle School, Joseph C. Chamberlain Elementary School, and Taunton High School.
Ownership History
Date
Name
Owned For
Owner Type
Purchase Details
Closed on
May 25, 1995
Sold by
T & M Rlty Corp
Bought by
Alden Chad L and Larson Janice M
Current Estimated Value
Create a Home Valuation Report for This Property
The Home Valuation Report is an in-depth analysis detailing your home's value as well as a comparison with similar homes in the area
Home Values in the Area
Average Home Value in this Area
Purchase History
| Date | Buyer | Sale Price | Title Company |
|---|---|---|---|
| Alden Chad L | $136,800 | -- |
Source: Public Records
Mortgage History
| Date | Status | Borrower | Loan Amount |
|---|---|---|---|
| Open | Alden Chad L | $288,000 | |
| Closed | Alden Chad L | $129,700 | |
| Closed | Alden Chad L | $20,000 |
Source: Public Records
Tax History Compared to Growth
Tax History
| Year | Tax Paid | Tax Assessment Tax Assessment Total Assessment is a certain percentage of the fair market value that is determined by local assessors to be the total taxable value of land and additions on the property. | Land | Improvement |
|---|---|---|---|---|
| 2025 | $6,403 | $585,300 | $140,200 | $445,100 |
| 2024 | $6,268 | $560,100 | $140,200 | $419,900 |
| 2023 | $5,642 | $468,200 | $133,800 | $334,400 |
| 2022 | $5,694 | $432,000 | $122,100 | $309,900 |
| 2021 | $213 | $369,500 | $111,000 | $258,500 |
| 2020 | $7,934 | $339,600 | $111,000 | $228,600 |
| 2019 | $7,807 | $329,500 | $111,000 | $218,500 |
| 2018 | $4,911 | $312,400 | $112,100 | $200,300 |
| 2017 | $7,335 | $309,200 | $106,300 | $202,900 |
| 2016 | $4,702 | $299,900 | $103,200 | $196,700 |
| 2015 | $4,622 | $307,900 | $105,100 | $202,800 |
| 2014 | $4,715 | $322,700 | $105,100 | $217,600 |
Source: Public Records
Map
Nearby Homes
- 25 Wintergreen Ln
- 3 Jeffrey Ln
- 51 Cobb Brook
- Lot 8 Joel Harvey Way
- 198 Taunton Ave Unit A
- 198 Taunton Ave Unit B
- 196 Taunton Ave Unit B
- 470 Hodges St
- 115 Ice House Rd
- 166 Alfred Lord Blvd
- 3 Gilberts Way
- 15 Alcott Cir Unit D3
- Lot 6 Tremont St
- 8 N Walker St
- 169 Powderhorn Dr
- 2 Riverway St
- 2 Upland Rd
- 193 Fremont St
- 38 Danielle St
- 16 Hunter St Unit A