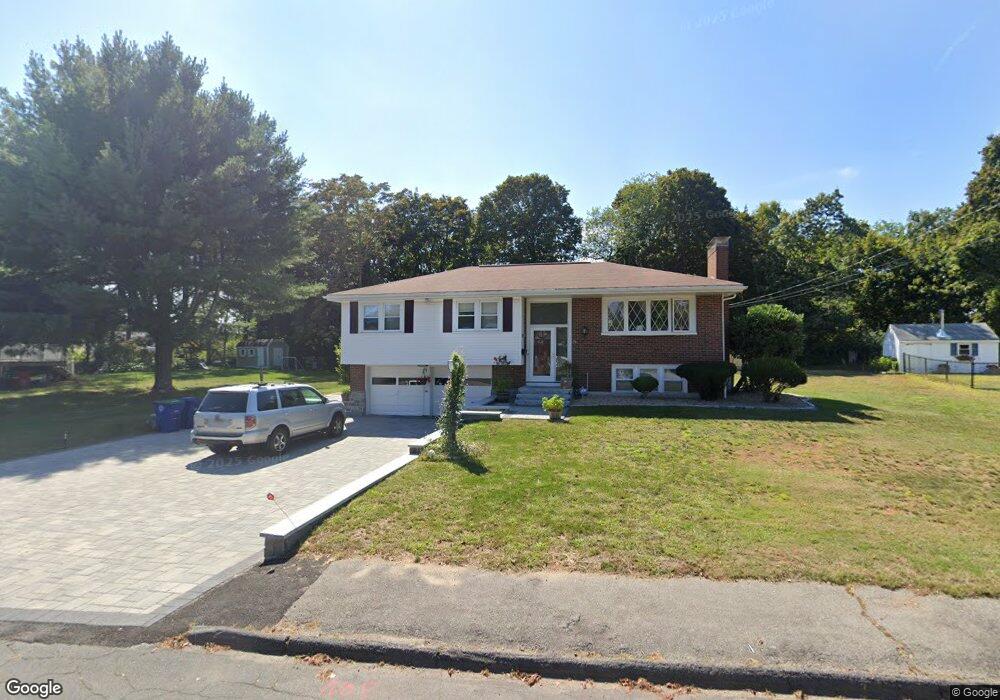
28 Tower Hill Rd Braintree, MA 02184
South Braintree NeighborhoodEstimated Value: $766,888 - $842,000
3
Beds
2
Baths
1,814
Sq Ft
$446/Sq Ft
Est. Value
About This Home
This home is located at 28 Tower Hill Rd, Braintree, MA 02184 and is currently estimated at $808,222, approximately $445 per square foot. 28 Tower Hill Rd is a home located in Norfolk County with nearby schools including Braintree High School, Thayer Academy, and South Shore SDA School.
Ownership History
Date
Name
Owned For
Owner Type
Purchase Details
Closed on
Jun 1, 2009
Sold by
Craig Jeanne
Bought by
Kwong Ricky C and Kwong Winnie
Current Estimated Value
Home Financials for this Owner
Home Financials are based on the most recent Mortgage that was taken out on this home.
Original Mortgage
$200,000
Outstanding Balance
$127,043
Interest Rate
4.87%
Mortgage Type
Purchase Money Mortgage
Estimated Equity
$681,179
Purchase Details
Closed on
Aug 3, 1992
Sold by
Giglio Stephen L and Giglio Claudia
Bought by
Craig Frank and Craig Jeanne
Purchase Details
Closed on
Dec 29, 1988
Sold by
Brown Margueriete
Bought by
Giglio Stephen L
Home Financials for this Owner
Home Financials are based on the most recent Mortgage that was taken out on this home.
Original Mortgage
$150,500
Interest Rate
10.26%
Mortgage Type
Purchase Money Mortgage
Create a Home Valuation Report for This Property
The Home Valuation Report is an in-depth analysis detailing your home's value as well as a comparison with similar homes in the area
Home Values in the Area
Average Home Value in this Area
Purchase History
| Date | Buyer | Sale Price | Title Company |
|---|---|---|---|
| Kwong Ricky C | $417,000 | -- | |
| Craig Frank | $205,000 | -- | |
| Craig Frank | $205,000 | -- | |
| Giglio Stephen L | $215,000 | -- |
Source: Public Records
Mortgage History
| Date | Status | Borrower | Loan Amount |
|---|---|---|---|
| Open | Kwong Ricky C | $200,000 | |
| Previous Owner | Giglio Stephen L | $150,500 |
Source: Public Records
Tax History Compared to Growth
Tax History
| Year | Tax Paid | Tax Assessment Tax Assessment Total Assessment is a certain percentage of the fair market value that is determined by local assessors to be the total taxable value of land and additions on the property. | Land | Improvement |
|---|---|---|---|---|
| 2025 | $7,143 | $715,700 | $444,100 | $271,600 |
| 2024 | $6,349 | $669,700 | $409,000 | $260,700 |
| 2023 | $6,047 | $619,600 | $374,000 | $245,600 |
| 2022 | $5,699 | $572,800 | $327,200 | $245,600 |
| 2021 | $5,311 | $533,800 | $295,700 | $238,100 |
| 2020 | $4,998 | $506,900 | $268,800 | $238,100 |
| 2019 | $5,156 | $511,000 | $268,800 | $242,200 |
| 2018 | $4,907 | $465,600 | $233,700 | $231,900 |
| 2017 | $4,748 | $442,100 | $222,100 | $220,000 |
| 2016 | $4,649 | $423,400 | $210,400 | $213,000 |
| 2015 | $4,616 | $417,000 | $205,700 | $211,300 |
| 2014 | $4,145 | $363,000 | $178,800 | $184,200 |
Source: Public Records
Map
Nearby Homes
- 7 Carter Rd
- 26 Sherman Rd
- 17 Royal Lake Dr Unit 4
- 57 Graziano Dr
- 80 Lake St
- 131 Jefferson St
- 6 Franklin St
- 65 Tremont St
- 305 Franklin St
- 145 Hancock St Unit 214
- 614 Pond St Unit 1405
- 614 Pond St Unit 2104
- 614 Pond St Unit 2305
- 614 Pond St Unit 1217
- 1307 Washington St
- 15 Highland Ave
- 14-20 Randall Ave
- 56 Plain St
- 47 Addison St
- 146 Eleanor Dr