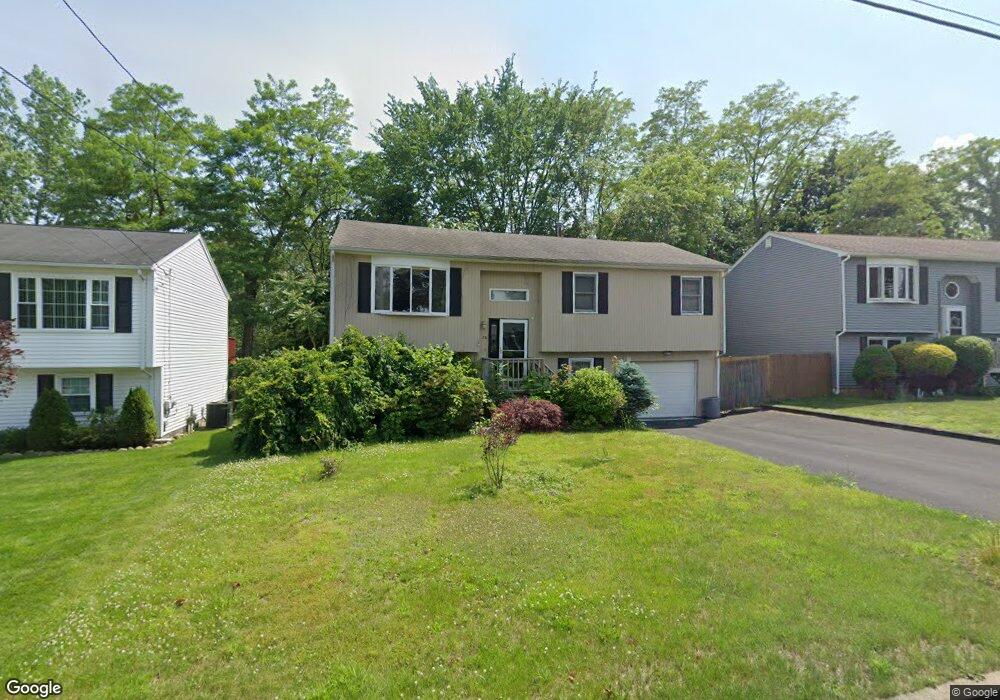
28 Urquhart St Cranston, RI 02920
Budlong NeighborhoodEstimated Value: $438,367 - $492,000
3
Beds
2
Baths
1,713
Sq Ft
$277/Sq Ft
Est. Value
About This Home
This home is located at 28 Urquhart St, Cranston, RI 02920 and is currently estimated at $474,342, approximately $276 per square foot. 28 Urquhart St is a home located in Providence County with nearby schools including Woodridge Elementary School, Western Hills Middle School, and Cranston High School West.
Ownership History
Date
Name
Owned For
Owner Type
Purchase Details
Closed on
Nov 30, 2006
Sold by
Chhlang Phivath and Chivchhlang Lena
Bought by
Alger Arnold
Current Estimated Value
Purchase Details
Closed on
Mar 30, 2004
Sold by
Chhlang Yong and Lam Leam
Bought by
Chhlang Phivath and Chiv-Chhlang Lena
Home Financials for this Owner
Home Financials are based on the most recent Mortgage that was taken out on this home.
Original Mortgage
$188,800
Interest Rate
5.65%
Mortgage Type
Purchase Money Mortgage
Purchase Details
Closed on
Dec 30, 1993
Sold by
Kirzhner Foma and Kirzhner Anna
Bought by
Chhlang Yong and Lam Leam Khang
Home Financials for this Owner
Home Financials are based on the most recent Mortgage that was taken out on this home.
Original Mortgage
$117,450
Interest Rate
7%
Create a Home Valuation Report for This Property
The Home Valuation Report is an in-depth analysis detailing your home's value as well as a comparison with similar homes in the area
Home Values in the Area
Average Home Value in this Area
Purchase History
| Date | Buyer | Sale Price | Title Company |
|---|---|---|---|
| Alger Arnold | $275,000 | -- | |
| Chhlang Phivath | $244,000 | -- | |
| Chhlang Yong | $117,000 | -- |
Source: Public Records
Mortgage History
| Date | Status | Borrower | Loan Amount |
|---|---|---|---|
| Previous Owner | Chhlang Yong | $220,000 | |
| Previous Owner | Chhlang Yong | $80,000 | |
| Previous Owner | Chhlang Yong | $188,800 | |
| Previous Owner | Chhlang Yong | $117,450 |
Source: Public Records
Tax History Compared to Growth
Tax History
| Year | Tax Paid | Tax Assessment Tax Assessment Total Assessment is a certain percentage of the fair market value that is determined by local assessors to be the total taxable value of land and additions on the property. | Land | Improvement |
|---|---|---|---|---|
| 2025 | $4,797 | $345,600 | $99,600 | $246,000 |
| 2024 | $4,704 | $345,600 | $99,600 | $246,000 |
| 2023 | $4,547 | $240,600 | $68,700 | $171,900 |
| 2022 | $4,454 | $240,600 | $68,700 | $171,900 |
| 2021 | $4,331 | $240,600 | $68,700 | $171,900 |
| 2020 | $4,374 | $210,600 | $65,200 | $145,400 |
| 2019 | $4,374 | $210,600 | $65,200 | $145,400 |
| 2018 | $4,273 | $210,600 | $65,200 | $145,400 |
| 2017 | $4,292 | $187,100 | $48,100 | $139,000 |
| 2016 | $4,200 | $187,100 | $48,100 | $139,000 |
| 2015 | $4,200 | $187,100 | $48,100 | $139,000 |
| 2014 | $3,846 | $168,400 | $48,100 | $120,300 |
Source: Public Records
Map
Nearby Homes