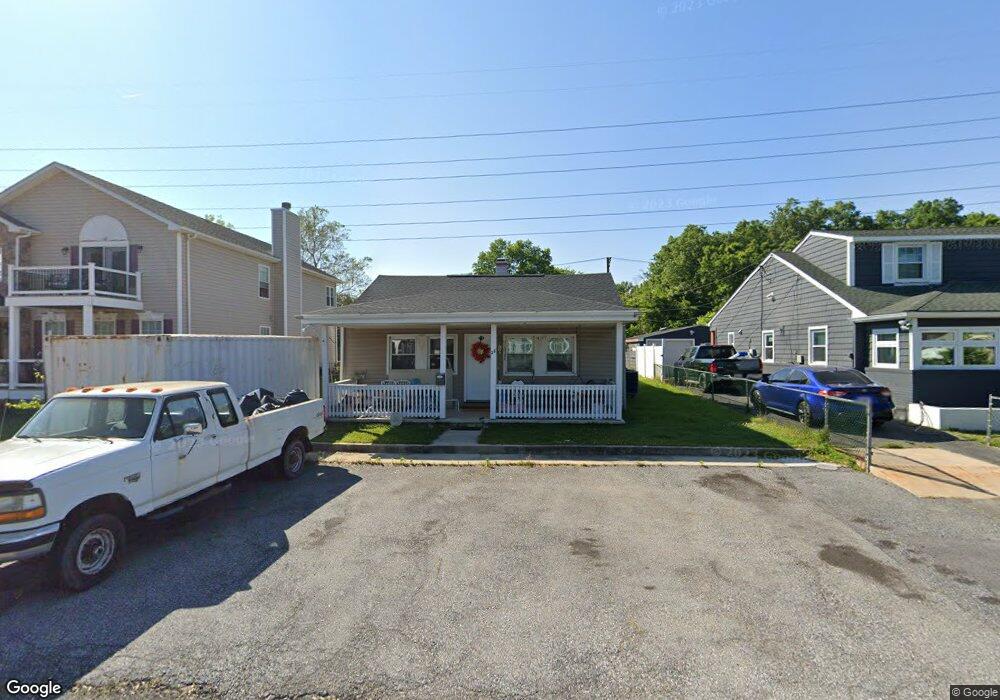
28 Walkway Ct Middle River, MD 21220
Estimated Value: $210,279 - $266,000
--
Bed
1
Bath
1,044
Sq Ft
$235/Sq Ft
Est. Value
About This Home
This home is located at 28 Walkway Ct, Middle River, MD 21220 and is currently estimated at $244,820, approximately $234 per square foot. 28 Walkway Ct is a home located in Baltimore County with nearby schools including Victory Villa Elementary School, Middle River Middle School, and Kenwood High.
Ownership History
Date
Name
Owned For
Owner Type
Purchase Details
Closed on
Mar 31, 2011
Sold by
Curran Brenda L
Bought by
Lafon Brenda L
Current Estimated Value
Home Financials for this Owner
Home Financials are based on the most recent Mortgage that was taken out on this home.
Original Mortgage
$184,000
Outstanding Balance
$128,534
Interest Rate
5.07%
Mortgage Type
New Conventional
Estimated Equity
$116,286
Purchase Details
Closed on
Mar 14, 2011
Sold by
Curran Brenda L
Bought by
Lafon Brenda L
Home Financials for this Owner
Home Financials are based on the most recent Mortgage that was taken out on this home.
Original Mortgage
$184,000
Outstanding Balance
$128,534
Interest Rate
5.07%
Mortgage Type
New Conventional
Estimated Equity
$116,286
Purchase Details
Closed on
Dec 13, 2001
Sold by
Gillum James E
Bought by
Curran Brenda L
Purchase Details
Closed on
May 20, 1992
Sold by
Lyons Malcomb H
Bought by
Gillum James E
Create a Home Valuation Report for This Property
The Home Valuation Report is an in-depth analysis detailing your home's value as well as a comparison with similar homes in the area
Home Values in the Area
Average Home Value in this Area
Purchase History
| Date | Buyer | Sale Price | Title Company |
|---|---|---|---|
| Lafon Brenda L | -- | -- | |
| Lafon Brenda L | -- | -- | |
| Curran Brenda L | $92,500 | -- | |
| Gillum James E | $75,000 | -- |
Source: Public Records
Mortgage History
| Date | Status | Borrower | Loan Amount |
|---|---|---|---|
| Open | Lafon Brenda L | $184,000 | |
| Closed | Lafon Brenda L | $184,000 |
Source: Public Records
Tax History Compared to Growth
Tax History
| Year | Tax Paid | Tax Assessment Tax Assessment Total Assessment is a certain percentage of the fair market value that is determined by local assessors to be the total taxable value of land and additions on the property. | Land | Improvement |
|---|---|---|---|---|
| 2025 | $2,671 | $180,367 | -- | -- |
| 2024 | $2,671 | $171,533 | $0 | $0 |
| 2023 | $1,346 | $162,700 | $53,000 | $109,700 |
| 2022 | $2,460 | $155,667 | $0 | $0 |
| 2021 | $2,378 | $148,633 | $0 | $0 |
| 2020 | $2,378 | $141,600 | $53,000 | $88,600 |
| 2019 | $2,452 | $140,967 | $0 | $0 |
| 2018 | $2,292 | $140,333 | $0 | $0 |
| 2017 | $2,121 | $139,700 | $0 | $0 |
| 2016 | $1,724 | $138,967 | $0 | $0 |
| 2015 | $1,724 | $138,233 | $0 | $0 |
| 2014 | $1,724 | $137,500 | $0 | $0 |
Source: Public Records
Map
Nearby Homes
- 33 Honeycomb Rd
- 59 Transverse Ave
- 3 Compression Ct
- 11 Torque Way
- 1806 Watermark Way
- 45 Chandelle Rd
- 9422 Windpine Rd
- 804 Thimbleberry Rd
- 547 Compass Rd E
- 6 Sweet Gum Ct
- 16 Yawmeter Dr
- 561 Compass Rd E
- 6 Gyro Dr
- 8 Red Bud Ct
- 1008 Fuselage Ave
- 15 Gyro Dr
- 826 Lowe Rd
- 110 Compass Rd
- 815 Lowe Rd
- 53 Longeron Dr