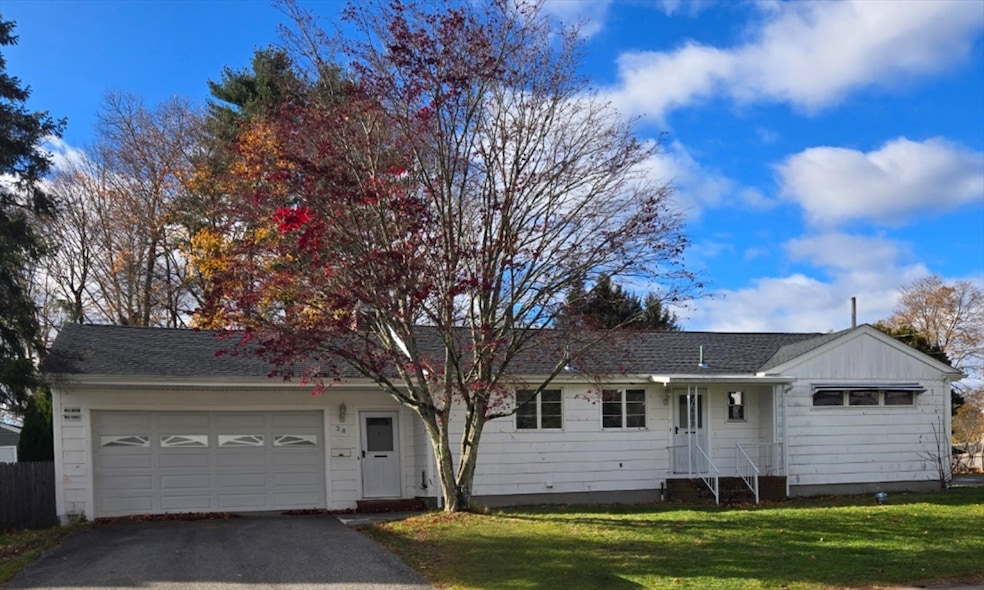
28 Wallace St Brockton, MA 02302
Campello NeighborhoodEstimated payment $3,084/month
Highlights
- Golf Course Community
- Property is near public transit
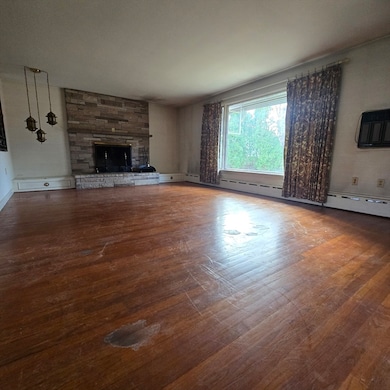
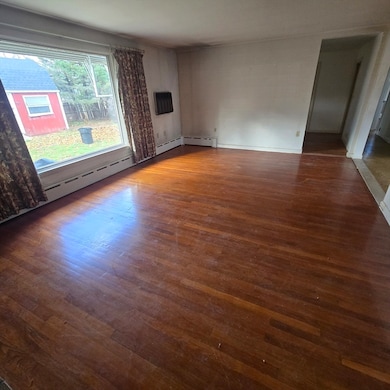
- Wood Flooring
- Medical Services
- Ranch Style House
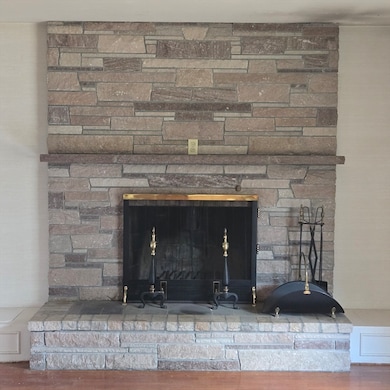
- 1 Fireplace
About This Home
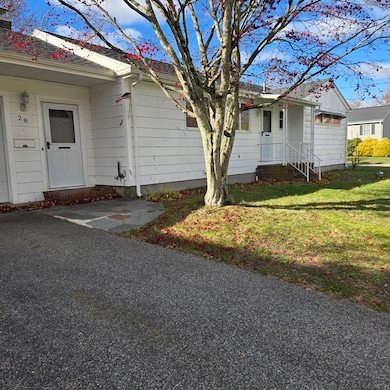
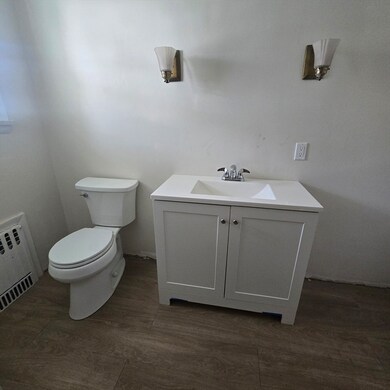
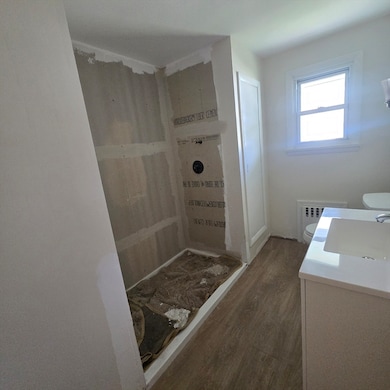
Bring your vision to this vintage 1958 ranch, loved by the same family since it was built and set on a spacious corner lot on a quiet side street. Much of its original character is ready to be restored, including newly revealed hardwood floors and custom solid-wood kitchen cabinets awaiting refinishing. The main bathroom has been refreshed with a new floor, toilet, vanity, and sink, with most of the work, including plumbing, already completed on a new walk-in shower. The inviting living room features a fireplace flanked by custom storage boxes for firewood and a large picture window overlooking the fully fenced backyard. A storage shed with electricity and running water from a private irrigation well adds convenience for gardening and outdoor projects. The basement offers a bonus room and a second full bath for expanded living potential. Major updates include the roof (2022), oil tank and oil burner (2012), and electrical system.
Home Details
Home Type
- Single Family
Est. Annual Taxes
- $5,326
Year Built
- Built in 1958
Lot Details
- 0.25 Acre Lot
- Fenced Yard
- Corner Lot
- Property is zoned R1C
Parking
- 2 Car Attached Garage
- Garage Door Opener
- Driveway
- Open Parking
- Off-Street Parking
Home Design
- Ranch Style House
- Frame Construction
- Shingle Roof
- Concrete Perimeter Foundation
Interior Spaces
- Central Vacuum
- 1 Fireplace
- Bonus Room
- Wood Flooring
Kitchen
- Oven
- Range
- Dishwasher
- Disposal
Bedrooms and Bathrooms
- 3 Bedrooms
- 2 Full Bathrooms
Partially Finished Basement
- Basement Fills Entire Space Under The House
- Interior Basement Entry
- Sump Pump
- Block Basement Construction
- Laundry in Basement
Location
- Property is near public transit
- Property is near schools
Schools
- Brockton High School
Utilities
- No Cooling
- 2 Heating Zones
- Heating System Uses Oil
- Baseboard Heating
- 200+ Amp Service
- Water Heater
Listing and Financial Details
- Assessor Parcel Number 130085,966609
Community Details
Overview
- No Home Owners Association
Amenities
- Medical Services
- Shops
- Coin Laundry
Recreation
- Golf Course Community
- Park
- Jogging Path
Map
Home Values in the Area
Average Home Value in this Area
Tax History
| Year | Tax Paid | Tax Assessment Tax Assessment Total Assessment is a certain percentage of the fair market value that is determined by local assessors to be the total taxable value of land and additions on the property. | Land | Improvement |
|---|---|---|---|---|
| 2025 | $5,326 | $439,800 | $160,400 | $279,400 |
| 2024 | $5,286 | $439,800 | $160,400 | $279,400 |
| 2023 | $4,995 | $384,800 | $110,700 | $274,100 |
| 2022 | $4,866 | $348,300 | $100,600 | $247,700 |
| 2021 | $4,492 | $309,800 | $93,500 | $216,300 |
| 2020 | $4,703 | $310,400 | $82,000 | $228,400 |
| 2019 | $4,544 | $292,400 | $78,300 | $214,100 |
| 2018 | $4,076 | $253,800 | $78,300 | $175,500 |
| 2017 | $3,843 | $238,700 | $78,300 | $160,400 |
| 2016 | $3,672 | $211,500 | $74,700 | $136,800 |
| 2015 | $3,372 | $185,800 | $74,700 | $111,100 |
| 2014 | $3,200 | $176,500 | $74,700 | $101,800 |
Property History
| Date | Event | Price | List to Sale | Price per Sq Ft |
|---|---|---|---|---|
| 11/19/2025 11/19/25 | For Sale | $499,900 | -- | $370 / Sq Ft |
Purchase History
| Date | Type | Sale Price | Title Company |
|---|---|---|---|
| Deed | -- | None Available | |
| Deed | -- | None Available | |
| Quit Claim Deed | -- | None Available | |
| Quit Claim Deed | -- | None Available | |
| Deed | -- | -- | |
| Deed | -- | -- |
Source: MLS Property Information Network (MLS PIN)
MLS Number: 73456561
APN: BROC-000130-000085
Disclaimer: Certain information contained herein is derived from information provided by parties other than Homes.com. All information provided is deemed reliable, but is not guaranteed to be accurate and should be independently verified.
![]() The property listing data and information, or the Images, set forth herein were provided to MLS Property Information Network, Inc. from third party sources, including sellers, lessors and public records, and were compiled by MLS Property Information Network, Inc. The property listing data and information, and the Images, are for the personal, non-commercial use of consumers having a good faith interest in purchasing or leasing listed properties of the type displayed to them and may not be used for any purpose other than to identify prospective properties which such consumers may have a good faith interest in purchasing or leasing. MLS Property Information Network, Inc. and its subscribers disclaim any and all representations and warranties as to the accuracy of the property listing data and information, or as to the accuracy of any of the Images, set forth herein.
The property listing data and information, or the Images, set forth herein were provided to MLS Property Information Network, Inc. from third party sources, including sellers, lessors and public records, and were compiled by MLS Property Information Network, Inc. The property listing data and information, and the Images, are for the personal, non-commercial use of consumers having a good faith interest in purchasing or leasing listed properties of the type displayed to them and may not be used for any purpose other than to identify prospective properties which such consumers may have a good faith interest in purchasing or leasing. MLS Property Information Network, Inc. and its subscribers disclaim any and all representations and warranties as to the accuracy of the property listing data and information, or as to the accuracy of any of the Images, set forth herein.
- 188 Perkins Ave Unit 188 Perkins Ave
- 165 Carl Ave
- 13 Perkins Ave Unit 1
- 25 E Nilsson St
- 58 Denton St
- 20 Watson St Unit 2
- 30 Holmes St Unit 1st floor
- 34 Hancock St Unit 1
- 60 Tremont St Unit 2
- 627 Crescent St Unit 2
- 9 Denton St Unit 3
- 692 Warren Ave Unit 1
- 341 Centre St Unit 1
- 22 Bolton Place Unit 1
- 92 Packard Way
- 65 Manchester St Unit STAY A WHILE
- 65 Manchester St Unit 1
- 436 Warren Ave Unit 1F
- 41 Carleton Ave Unit 2
- 41 Carleton Ave Unit 1
