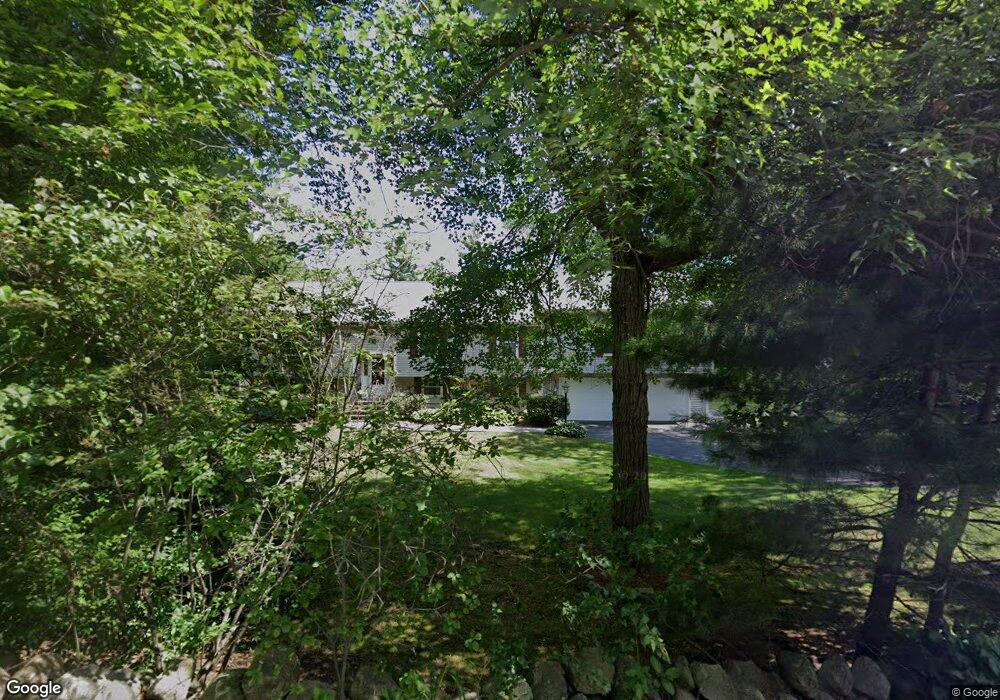
28 Walnut St Foxboro, MA 02035
Estimated Value: $705,000 - $968,000
3
Beds
2
Baths
2,000
Sq Ft
$418/Sq Ft
Est. Value
About This Home
This home is located at 28 Walnut St, Foxboro, MA 02035 and is currently estimated at $835,493, approximately $417 per square foot. 28 Walnut St is a home located in Norfolk County with nearby schools including Foxborough High School, Foxborough Regional Charter School, and Hands-On-Montessori School.
Ownership History
Date
Name
Owned For
Owner Type
Purchase Details
Closed on
Mar 15, 2000
Sold by
Picchi Mark A and Picchi Lisa M
Bought by
Gibbons Matthew C and Gibbons Claire M
Current Estimated Value
Purchase Details
Closed on
Feb 4, 1994
Sold by
Mccarthy Robert G
Bought by
Picchi Mark A and Picchi Lisa M
Purchase Details
Closed on
Mar 24, 1989
Sold by
Robinson Charles
Bought by
Mccarthy Robert G
Create a Home Valuation Report for This Property
The Home Valuation Report is an in-depth analysis detailing your home's value as well as a comparison with similar homes in the area
Home Values in the Area
Average Home Value in this Area
Purchase History
| Date | Buyer | Sale Price | Title Company |
|---|---|---|---|
| Gibbons Matthew C | $272,000 | -- | |
| Picchi Mark A | $168,900 | -- | |
| Mccarthy Robert G | $190,000 | -- |
Source: Public Records
Mortgage History
| Date | Status | Borrower | Loan Amount |
|---|---|---|---|
| Open | Mccarthy Robert G | $289,950 | |
| Closed | Mccarthy Robert G | $296,000 | |
| Closed | Mccarthy Robert G | $211,500 |
Source: Public Records
Tax History Compared to Growth
Tax History
| Year | Tax Paid | Tax Assessment Tax Assessment Total Assessment is a certain percentage of the fair market value that is determined by local assessors to be the total taxable value of land and additions on the property. | Land | Improvement |
|---|---|---|---|---|
| 2025 | $9,714 | $734,800 | $262,000 | $472,800 |
| 2024 | $9,017 | $667,400 | $262,000 | $405,400 |
| 2023 | $8,763 | $616,700 | $249,600 | $367,100 |
| 2022 | $8,446 | $581,700 | $238,900 | $342,800 |
| 2021 | $7,699 | $522,300 | $217,200 | $305,100 |
| 2020 | $7,133 | $489,600 | $217,200 | $272,400 |
| 2019 | $7,016 | $477,300 | $206,800 | $270,500 |
| 2018 | $6,737 | $462,400 | $206,800 | $255,600 |
| 2017 | $6,577 | $437,300 | $193,200 | $244,100 |
| 2016 | $6,639 | $448,000 | $186,100 | $261,900 |
| 2015 | $6,436 | $423,700 | $157,100 | $266,600 |
| 2014 | $6,305 | $420,600 | $154,000 | $266,600 |
Source: Public Records
Map
Nearby Homes
- 12 Spring St
- 356 Central St
- 80 Mill St
- 11 W Belcher Rd Unit 2
- 18 Winter St Unit E
- 84 Cocasset St Unit A6
- 24 Mechanic St
- 406 South St
- 14 Baker St
- 14 Winter St Unit B
- 11 Orchard Place Unit 11
- 450 West St
- 166 Chauncy St
- 619 N Main St
- 28 Angell St
- 42 Angell St
- 44 Angell St Unit 44
- 14 Foxhill Rd
- 22 Pleasant St Unit C
- 82 Brook St