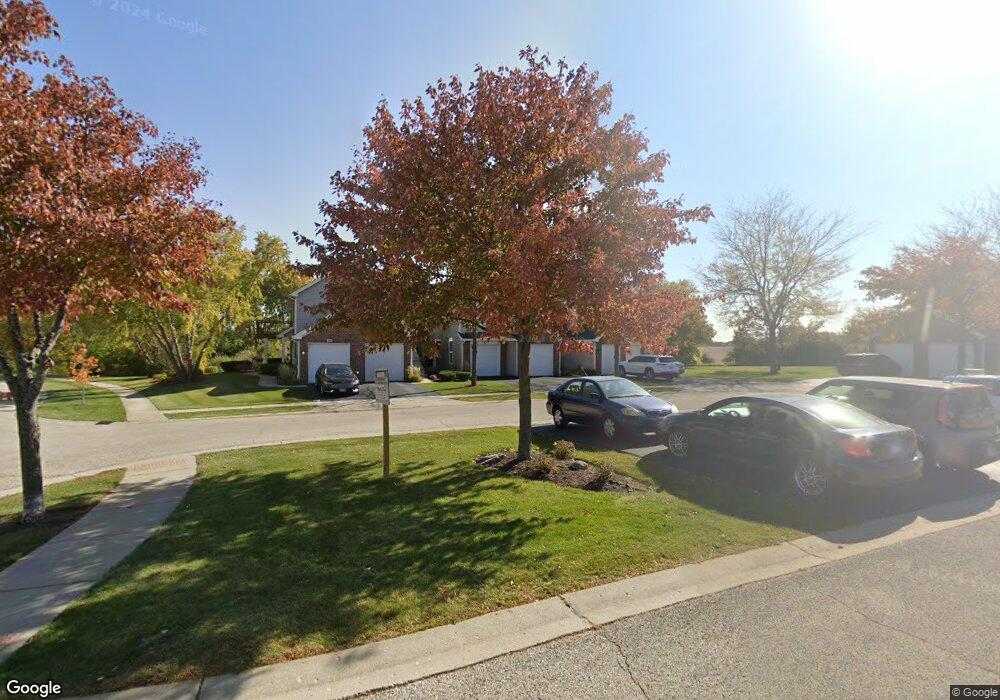
28 Waverly Ct Unit 4375 Algonquin, IL 60102
Estimated Value: $240,672 - $270,000
2
Beds
--
Bath
1,230
Sq Ft
$211/Sq Ft
Est. Value
About This Home
This home is located at 28 Waverly Ct Unit 4375, Algonquin, IL 60102 and is currently estimated at $259,668, approximately $211 per square foot. 28 Waverly Ct Unit 4375 is a home located in Kane County with nearby schools including Westfield Community School and Harry D Jacobs High School.
Ownership History
Date
Name
Owned For
Owner Type
Purchase Details
Closed on
Jan 8, 2017
Sold by
Jean Noll and Tellez Alejndra
Bought by
Phh Mortgage Corporation
Current Estimated Value
Purchase Details
Closed on
Mar 31, 2000
Sold by
Aiello Brian E and Aiello Malinda A
Bought by
Shelby David and Noll Jean
Home Financials for this Owner
Home Financials are based on the most recent Mortgage that was taken out on this home.
Original Mortgage
$100,000
Interest Rate
8.24%
Mortgage Type
FHA
Purchase Details
Closed on
Nov 16, 1995
Sold by
Willoughby Farms Townhomes Ltd Prtrnrshp
Bought by
Aiello Brian and Aiello Malinda
Home Financials for this Owner
Home Financials are based on the most recent Mortgage that was taken out on this home.
Original Mortgage
$106,200
Interest Rate
7.56%
Mortgage Type
FHA
Create a Home Valuation Report for This Property
The Home Valuation Report is an in-depth analysis detailing your home's value as well as a comparison with similar homes in the area
Purchase History
| Date | Buyer | Sale Price | Title Company |
|---|---|---|---|
| Phh Mortgage Corporation | $91,500 | None Available | |
| Shelby David | $113,000 | -- | |
| Aiello Brian | $110,000 | Chicago Title Insurance Co |
Source: Public Records
Mortgage History
| Date | Status | Borrower | Loan Amount |
|---|---|---|---|
| Previous Owner | Shelby David | $100,000 | |
| Previous Owner | Aiello Brian | $106,200 |
Source: Public Records
Tax History
| Year | Tax Paid | Tax Assessment Tax Assessment Total Assessment is a certain percentage of the fair market value that is determined by local assessors to be the total taxable value of land and additions on the property. | Land | Improvement |
|---|---|---|---|---|
| 2024 | $5,190 | $68,264 | $8,371 | $59,893 |
| 2023 | $4,999 | $61,422 | $7,532 | $53,890 |
| 2022 | $4,174 | $49,951 | $7,532 | $42,419 |
| 2021 | $4,067 | $47,164 | $7,112 | $40,052 |
| 2020 | $3,994 | $46,104 | $6,952 | $39,152 |
| 2019 | $3,886 | $43,767 | $6,600 | $37,167 |
| 2018 | $3,702 | $40,148 | $6,469 | $33,679 |
| 2017 | $3,571 | $37,556 | $6,051 | $31,505 |
| 2016 | $3,672 | $36,363 | $5,859 | $30,504 |
| 2015 | -- | $28,850 | $5,490 | $23,360 |
| 2014 | -- | $28,053 | $5,338 | $22,715 |
| 2013 | -- | $33,656 | $5,501 | $28,155 |
Source: Public Records
Map
Nearby Homes
- 1900 Waverly Ln
- Amherst Plan at Algonquin Meadows - Urban Townhomes
- Chatham Plan at Algonquin Meadows - Urban Townhomes
- Chelsea Plan at Algonquin Meadows - Urban Townhomes
- Adams Plan at Algonquin Meadows - Single Family
- Sequoia Plan at Algonquin Meadows - Single Family
- Bryce Plan at Algonquin Meadows - Single Family
- Rainier Plan at Algonquin Meadows - Single Family
- Santa Rosa Plan at Algonquin Meadows - Single Family
- Biscayne Plan at Algonquin Meadows - Single Family
- 1239 Glenmont St
- 1141 Glenmont St
- 1090 Glenmont St
- 1247 Glenmont St
- 1250 Glenmont St
- 1241 Glenmont St
- 1111 Glenmont St
- 1243 Glenmont St
- 1080 Glenmont St
- 1030 Glenmont St
- 34 Waverly Ct Unit 4372
- 30 Waverly Ct Unit 4374
- 32 Waverly Ct Unit 4373
- 36 Waverly Ct Unit 4371
- 28 Waverly Ct Unit 28
- 28 Waverly Ct
- 26 Waverly Ct Unit 4376
- 2061 Waverly Ln Unit 4404
- 14 Waverly Ct Unit 4366
- 2071 Waverly Ln Unit 4391
- 2073 Waverly Ln Unit 4392
- 2075 Waverly Ln Unit 4393
- 16 Waverly Ct Unit 4365
- 20 Waverly Ct Unit 4363
- 22 Waverly Ct Unit 4362
- 18 Waverly Ct Unit 4364
- 24 Waverly Ct Unit 4361
- 24 Waverly Ct Unit 24
- 2081 Waverly Ln Unit 4394
- 2081 Waverly Ln Unit 2081
Your Personal Tour Guide
Ask me questions while you tour the home.