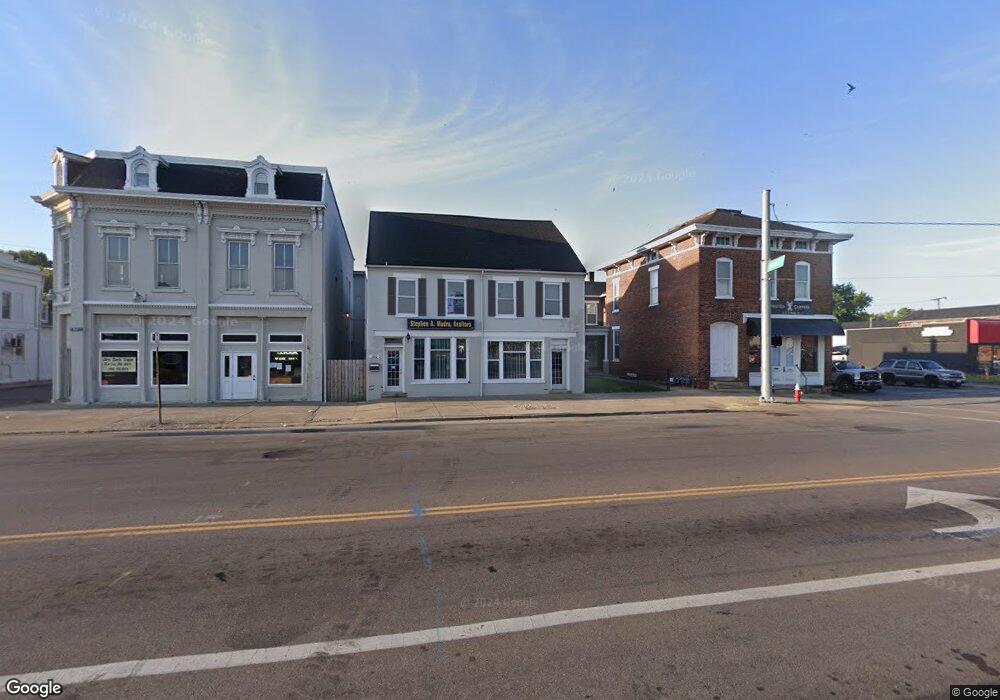
280 E Main St Chillicothe, OH 45601
Estimated Value: $345,000 - $354,515
Studio
3
Baths
1,968
Sq Ft
$178/Sq Ft
Est. Value
About This Home
This home is located at 280 E Main St, Chillicothe, OH 45601 and is currently estimated at $349,379, approximately $177 per square foot. 280 E Main St is a home located in Ross County with nearby schools including Chillicothe High School, Bishop Flaget School, and Wesley Taylor Preparatory School.
Ownership History
Date
Name
Owned For
Owner Type
Purchase Details
Closed on
Oct 14, 2022
Sold by
Madru Stephen A
Bought by
Collins Robert A and Collins Kelly A
Current Estimated Value
Home Financials for this Owner
Home Financials are based on the most recent Mortgage that was taken out on this home.
Original Mortgage
$303,403
Outstanding Balance
$292,073
Interest Rate
6.92%
Estimated Equity
$57,306
Create a Home Valuation Report for This Property
The Home Valuation Report is an in-depth analysis detailing your home's value as well as a comparison with similar homes in the area
Home Values in the Area
Average Home Value in this Area
Purchase History
| Date | Buyer | Sale Price | Title Company |
|---|---|---|---|
| Collins Robert A | $309,000 | -- | |
| Collins Robert A | $309,000 | None Listed On Document |
Source: Public Records
Mortgage History
| Date | Status | Borrower | Loan Amount |
|---|---|---|---|
| Open | Collins Robert A | $303,403 | |
| Closed | Collins Robert A | $303,403 |
Source: Public Records
Tax History
| Year | Tax Paid | Tax Assessment Tax Assessment Total Assessment is a certain percentage of the fair market value that is determined by local assessors to be the total taxable value of land and additions on the property. | Land | Improvement |
|---|---|---|---|---|
| 2024 | $3,201 | $80,300 | $23,750 | $56,550 |
| 2023 | $3,201 | $80,300 | $23,750 | $56,550 |
| 2022 | $3,335 | $80,300 | $23,750 | $56,550 |
| 2021 | $3,334 | $70,380 | $21,590 | $48,790 |
| 2020 | $3,334 | $70,380 | $21,590 | $48,790 |
| 2019 | $3,336 | $70,380 | $21,590 | $48,790 |
| 2018 | $3,413 | $68,190 | $21,590 | $46,600 |
| 2017 | $3,674 | $68,190 | $21,590 | $46,600 |
| 2016 | $3,640 | $68,190 | $21,590 | $46,600 |
| 2015 | $3,510 | $64,140 | $21,590 | $42,550 |
| 2014 | $3,443 | $64,140 | $21,590 | $42,550 |
| 2013 | $3,983 | $76,220 | $21,590 | $54,630 |
Source: Public Records
Map
Nearby Homes
- 0 N Bridge St
- 0 Ohio 159
- 348 E 4th St
- 81 S Hickory St
- 72 N Hickory St
- 153 Hirn St
- 158 N Sugar St
- 90 E 2nd St
- 394 Clay St
- 219 N Bridge St
- 520-522 E Water St
- 249 Madeira Ave
- 320 Mckellar St
- 0 US Hwy 23 Unit 198667
- 23 N Brownell St
- 607 E Main St
- 255 Caldwell St
- 29 S Watt St
- 692 Washington Ave
- 746 Madison Ave
Your Personal Tour Guide
Ask me questions while you tour the home.