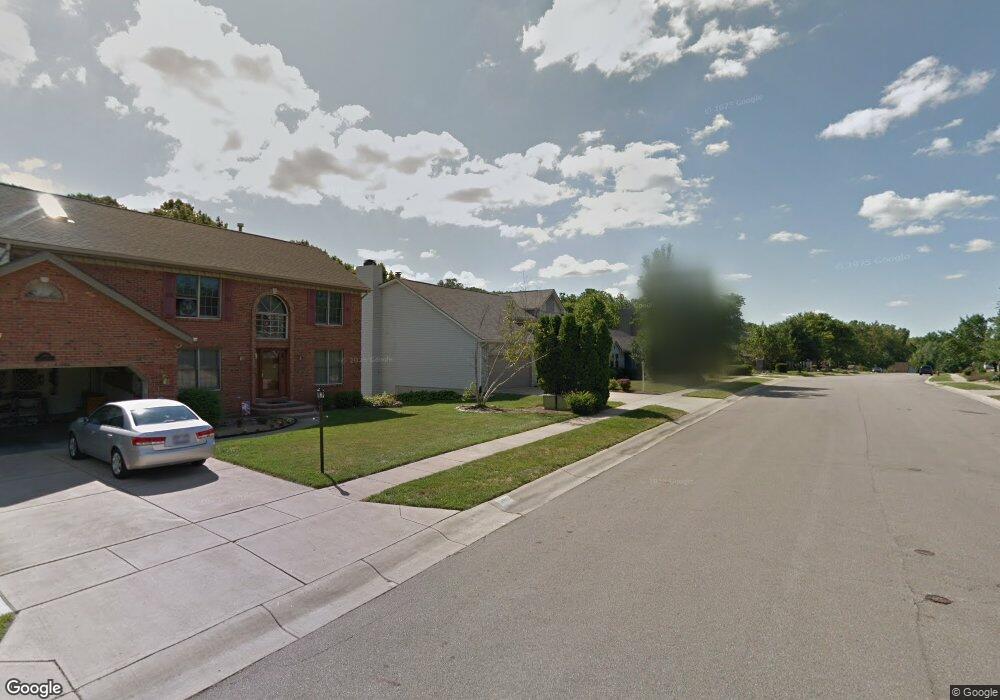
280 Foliage Ln Springboro, OH 45066
Estimated Value: $398,703 - $455,000
3
Beds
4
Baths
2,815
Sq Ft
$149/Sq Ft
Est. Value
About This Home
This home is located at 280 Foliage Ln, Springboro, OH 45066 and is currently estimated at $419,676, approximately $149 per square foot. 280 Foliage Ln is a home located in Warren County with nearby schools including Clearcreek Elementary School, Springboro Intermediate School, and Dennis Elementary School.
Ownership History
Date
Name
Owned For
Owner Type
Purchase Details
Closed on
Oct 19, 2018
Sold by
Guy Bradley W and Draime Jill J
Bought by
Quebatay Marshal Q and Quebatay Maria Cristina
Current Estimated Value
Home Financials for this Owner
Home Financials are based on the most recent Mortgage that was taken out on this home.
Original Mortgage
$291,127
Outstanding Balance
$252,340
Interest Rate
4.6%
Mortgage Type
VA
Estimated Equity
$167,336
Purchase Details
Closed on
Jan 18, 2000
Sold by
Zadafshar Hosein
Bought by
Draime Bradley Guy Jill J
Home Financials for this Owner
Home Financials are based on the most recent Mortgage that was taken out on this home.
Original Mortgage
$186,650
Interest Rate
7.89%
Mortgage Type
VA
Purchase Details
Closed on
Oct 17, 1990
Sold by
Lemon Paul A and Lemon Jean
Bought by
Zadafshar and Zadafshar Hosein
Purchase Details
Closed on
Nov 10, 1987
Sold by
Lemon Paul A and Lemon Jean
Bought by
Lemon and Lemon Paul A
Create a Home Valuation Report for This Property
The Home Valuation Report is an in-depth analysis detailing your home's value as well as a comparison with similar homes in the area
Home Values in the Area
Average Home Value in this Area
Purchase History
| Date | Buyer | Sale Price | Title Company |
|---|---|---|---|
| Quebatay Marshal Q | $285,000 | Vantage Land Title | |
| Draime Bradley Guy Jill J | $183,000 | -- | |
| Zadafshar | $28,500 | -- | |
| Lemon | -- | -- |
Source: Public Records
Mortgage History
| Date | Status | Borrower | Loan Amount |
|---|---|---|---|
| Open | Quebatay Marshal Q | $291,127 | |
| Previous Owner | Draime Bradley Guy Jill J | $186,650 |
Source: Public Records
Tax History
| Year | Tax Paid | Tax Assessment Tax Assessment Total Assessment is a certain percentage of the fair market value that is determined by local assessors to be the total taxable value of land and additions on the property. | Land | Improvement |
|---|---|---|---|---|
| 2025 | $4,255 | $108,960 | $29,750 | $79,210 |
| 2024 | $4,255 | $108,960 | $29,750 | $79,210 |
| 2023 | $3,719 | $87,328 | $17,220 | $70,108 |
| 2022 | $3,664 | $87,329 | $17,220 | $70,109 |
| 2021 | $3,410 | $87,329 | $17,220 | $70,109 |
| 2020 | $3,171 | $70,998 | $14,000 | $56,998 |
| 2019 | $2,924 | $70,998 | $14,000 | $56,998 |
| 2018 | $2,926 | $70,998 | $14,000 | $56,998 |
| 2017 | $2,765 | $60,428 | $12,110 | $48,318 |
| 2016 | $2,883 | $60,428 | $12,110 | $48,318 |
| 2015 | $2,890 | $60,428 | $12,110 | $48,318 |
| 2014 | $2,851 | $56,480 | $11,320 | $45,160 |
| 2013 | $2,849 | $69,860 | $14,000 | $55,860 |
Source: Public Records
Map
Nearby Homes
- 245 Whispering Pines St
- 350 Spruceway Dr
- 23 Pheasant Run Cir Unit 9A
- 72 Tamarack Trail
- 510 Royal Springs Dr
- 20 Fairfield Ct
- 20 Terradyne Trace
- 500 W Market St
- 35 Edgebrooke Dr
- 1101 Parklake Row
- 4 Chestnut St
- 72 Pebble Brook Place
- 70 Eleanor Dr
- 105 Cherry St
- 45 Wadestone St
- 40 Libby Hollow St
- 90 Libby Hollow St
- 140 Dan Haven Place
- 15 Wadestone Ln
- Calvin Plan at Wadestone - Designer Collection
- 290 Foliage Ln
- 300 Foliage Ln
- 275 Foliage Ln
- 285 Foliage Ln
- 265 Foliage Ln
- 310 Foliage Ln
- 250 Foliage Ln
- 255 Foliage Ln
- 305 Foliage Ln
- 155 Jeanne Dr
- 240 Foliage Ln
- 245 Foliage Ln
- 315 Foliage Ln
- 165 Jeanne Dr
- 230 Foliage Ln
- 170 Lemonwood Ct
- 160 Jeanne Dr
- 235 Foliage Ln
- 160 Lemonwood Ct
- 261 Tamarack Trail
Your Personal Tour Guide
Ask me questions while you tour the home.