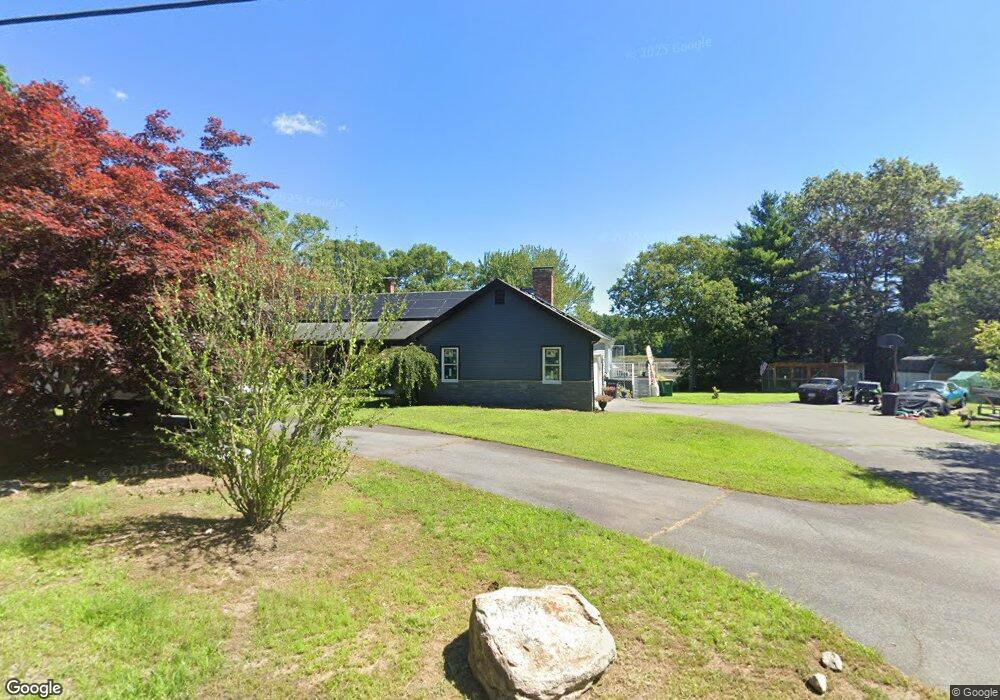
280 Meadow St Carver, MA 02330
Estimated Value: $640,000 - $668,000
3
Beds
2
Baths
1,744
Sq Ft
$375/Sq Ft
Est. Value
About This Home
This home is located at 280 Meadow St, Carver, MA 02330 and is currently estimated at $653,177, approximately $374 per square foot. 280 Meadow St is a home located in Plymouth County with nearby schools including Carver Elementary School and Carver Middle/High School.
Ownership History
Date
Name
Owned For
Owner Type
Purchase Details
Closed on
Jul 28, 2006
Sold by
Paulding Robert E and Paulding Kathleen B
Bought by
Stpierre James L and Stpierre Beverly L
Current Estimated Value
Home Financials for this Owner
Home Financials are based on the most recent Mortgage that was taken out on this home.
Original Mortgage
$180,000
Outstanding Balance
$107,540
Interest Rate
6.67%
Mortgage Type
Purchase Money Mortgage
Estimated Equity
$545,637
Purchase Details
Closed on
Nov 2, 2000
Sold by
Hannula Brenda J
Bought by
Paulding Robert E and Pauling Kathleen B
Create a Home Valuation Report for This Property
The Home Valuation Report is an in-depth analysis detailing your home's value as well as a comparison with similar homes in the area
Home Values in the Area
Average Home Value in this Area
Purchase History
| Date | Buyer | Sale Price | Title Company |
|---|---|---|---|
| Stpierre James L | $380,000 | -- | |
| Paulding Robert E | $269,000 | -- |
Source: Public Records
Mortgage History
| Date | Status | Borrower | Loan Amount |
|---|---|---|---|
| Open | Paulding Robert E | $180,000 | |
| Previous Owner | Paulding Robert E | $274,400 | |
| Previous Owner | Paulding Robert E | $209,000 |
Source: Public Records
Tax History Compared to Growth
Tax History
| Year | Tax Paid | Tax Assessment Tax Assessment Total Assessment is a certain percentage of the fair market value that is determined by local assessors to be the total taxable value of land and additions on the property. | Land | Improvement |
|---|---|---|---|---|
| 2025 | $8,264 | $595,800 | $156,300 | $439,500 |
| 2024 | $7,871 | $555,500 | $160,800 | $394,700 |
| 2023 | $7,566 | $518,600 | $160,800 | $357,800 |
| 2022 | $7,197 | $450,400 | $137,500 | $312,900 |
| 2021 | $6,640 | $392,000 | $122,800 | $269,200 |
| 2020 | $6,376 | $370,900 | $114,700 | $256,200 |
| 2019 | $6,150 | $360,700 | $111,400 | $249,300 |
| 2018 | $5,751 | $328,100 | $111,400 | $216,700 |
| 2017 | $5,532 | $312,700 | $107,200 | $205,500 |
| 2016 | $5,128 | $301,100 | $102,100 | $199,000 |
| 2015 | $4,821 | $283,400 | $102,100 | $181,300 |
| 2014 | $4,776 | $280,800 | $129,000 | $151,800 |
Source: Public Records
Map
Nearby Homes