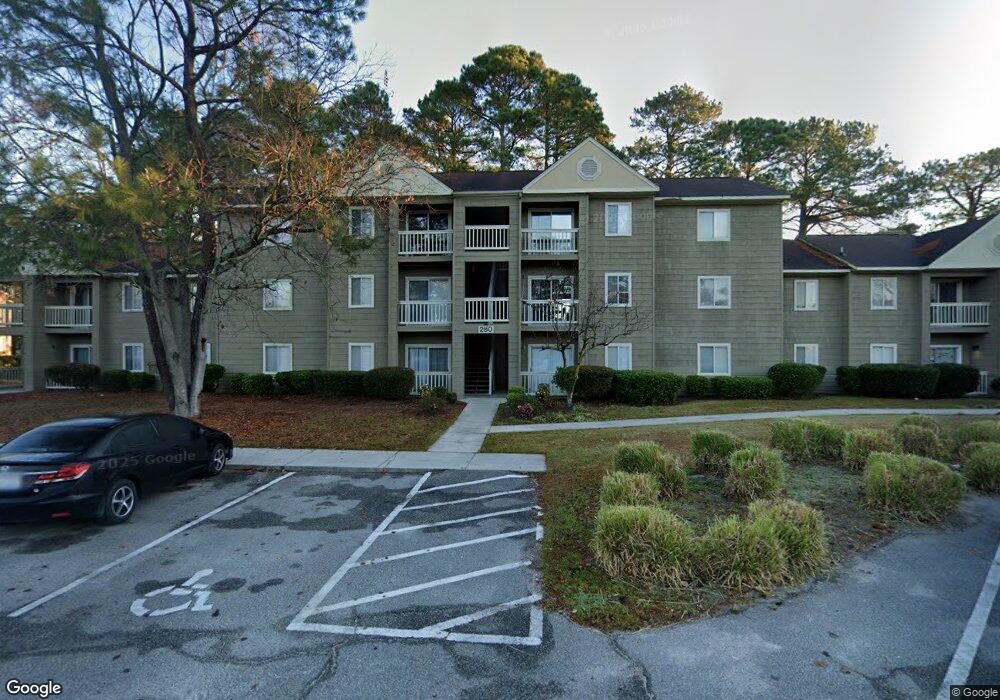
280 Myrtle Greens Dr Unit 280I Conway, SC 29526
Estimated Value: $121,000 - $133,000
2
Beds
2
Baths
1,028
Sq Ft
$123/Sq Ft
Est. Value
About This Home
This home is located at 280 Myrtle Greens Dr Unit 280I, Conway, SC 29526 and is currently estimated at $126,623, approximately $123 per square foot. 280 Myrtle Greens Dr Unit 280I is a home located in Horry County with nearby schools including Palmetto Bays Elementary School, Black Water Middle School, and Carolina Forest High School.
Ownership History
Date
Name
Owned For
Owner Type
Purchase Details
Closed on
Jun 26, 2018
Sold by
Coleman James R
Bought by
Browne Michael Joseph and Sledzik Browne Lynda
Current Estimated Value
Purchase Details
Closed on
Aug 24, 2007
Sold by
I-280 Llc
Bought by
Coleman James R
Home Financials for this Owner
Home Financials are based on the most recent Mortgage that was taken out on this home.
Original Mortgage
$87,300
Interest Rate
6.65%
Mortgage Type
Purchase Money Mortgage
Purchase Details
Closed on
Jun 28, 2005
Sold by
Snead William R and Snead Linda R
Bought by
I-280 Llc
Purchase Details
Closed on
Sep 30, 1999
Sold by
Schmidtke Judith A and Schmidtke Lowell W
Bought by
Snead William R and Snead Linda R
Home Financials for this Owner
Home Financials are based on the most recent Mortgage that was taken out on this home.
Original Mortgage
$51,900
Interest Rate
7.85%
Mortgage Type
Purchase Money Mortgage
Create a Home Valuation Report for This Property
The Home Valuation Report is an in-depth analysis detailing your home's value as well as a comparison with similar homes in the area
Home Values in the Area
Average Home Value in this Area
Purchase History
| Date | Buyer | Sale Price | Title Company |
|---|---|---|---|
| Browne Michael Joseph | $62,000 | -- | |
| Coleman James R | $97,000 | Attorney | |
| I-280 Llc | $78,900 | -- | |
| Snead William R | $64,900 | -- |
Source: Public Records
Mortgage History
| Date | Status | Borrower | Loan Amount |
|---|---|---|---|
| Previous Owner | Coleman James R | $87,300 | |
| Previous Owner | Snead William R | $51,900 |
Source: Public Records
Tax History Compared to Growth
Tax History
| Year | Tax Paid | Tax Assessment Tax Assessment Total Assessment is a certain percentage of the fair market value that is determined by local assessors to be the total taxable value of land and additions on the property. | Land | Improvement |
|---|---|---|---|---|
| 2024 | $992 | $9,000 | $0 | $9,000 |
| 2023 | $992 | $6,825 | $0 | $6,825 |
| 2021 | $919 | $6,825 | $0 | $6,825 |
| 2020 | $844 | $6,825 | $0 | $6,825 |
| 2019 | $844 | $6,825 | $0 | $6,825 |
| 2018 | $785 | $6,090 | $0 | $6,090 |
| 2017 | $770 | $3,480 | $0 | $3,480 |
| 2016 | -- | $3,480 | $0 | $3,480 |
| 2015 | $770 | $6,090 | $0 | $6,090 |
| 2014 | $745 | $3,480 | $0 | $3,480 |
Source: Public Records
Map
Nearby Homes
- 320 Myrtle Greens Dr Unit 320-A
- 300-J Myrtle Greens Dr Unit 300 J
- 804 Wylie Ct
- 412 Wellman Ct
- 419 Wellman Ct
- 150 Cart Crossing Dr Unit 103
- 400 Myrtle Greens Dr Unit C
- 1109 Woodford Ct
- 110 Cart Crossing Dr Unit 102
- 425 Myrtle Greens Dr Unit B
- 125 Westville Dr
- 480 Myrtle Greens Dr Unit G
- 800 Wilcot Branch Ct
- 100 Willow Green Dr Unit A
- Lot 11 Professional Park Dr
- 145 Ridge Point Dr
- 137 Hickory Dr
- 891 Helms Way
- 206 Glenwood Dr
- 123 Hickory Dr
- 280 Myrtle Greens Dr Unit I
- 280 Myrtle Greens Dr
- 280 Myrtle Greens Dr Unit D Myrtle Greens
- 280 Myrtle Greens Dr
- 280-G Myrtle Greens Dr
- 280 Myrtle Greens Dr Unit D
- 280F Myrtle Greens Dr Unit 280F
- 280 Myrtle Greens Dr Unit E
- 280 Myrtle Greens Dr Unit C
- 280 Myrtle Greens Dr Unit 280
- 280A Myrtle Greens Dr Unit 280A
- 280 Myrtle Greens Dr Unit D
- 280 Myrtle Greens Dr Unit H
- 280 Myrtle Greens Dr Unit F
- 280-B Myrtle Greens Dr Unit 280
- 280 Myrtle Greens Dr Unit G
- 280J Myrtle Greens Dr Unit 280J
- 280H Myrtle Greens Dr Unit 280H
- 280G Myrtle Greens Dr Unit 280G
- 1008 Woodall Ct