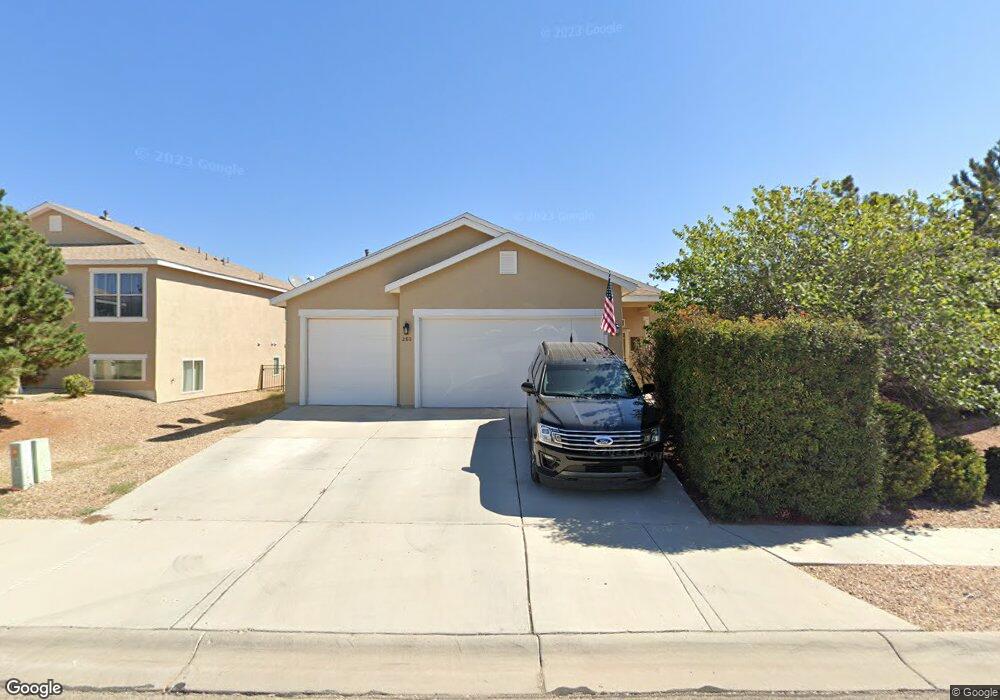
280 Open Range Ave SW Unit 1 Los Lunas, NM 87031
West Los Lunas NeighborhoodEstimated Value: $296,000 - $363,617
4
Beds
3
Baths
2,734
Sq Ft
$122/Sq Ft
Est. Value
About This Home
This home is located at 280 Open Range Ave SW Unit 1, Los Lunas, NM 87031 and is currently estimated at $334,404, approximately $122 per square foot. 280 Open Range Ave SW Unit 1 is a home located in Valencia County with nearby schools including Sundance Elementary School, Los Lunas Middle School, and Los Lunas High School.
Ownership History
Date
Name
Owned For
Owner Type
Purchase Details
Closed on
Dec 13, 2024
Sold by
Pluemer Julie
Bought by
Pluemer Greg
Current Estimated Value
Purchase Details
Closed on
Jul 26, 2012
Sold by
Bokf Na
Bought by
Secertary Of Veterans Affairs
Purchase Details
Closed on
Jul 3, 2012
Sold by
Mitchell David
Bought by
Bokf Na and Bank Of Oklahoma
Purchase Details
Closed on
Mar 16, 2006
Sold by
Artistic Homes Inc
Bought by
Ashton Scot A
Home Financials for this Owner
Home Financials are based on the most recent Mortgage that was taken out on this home.
Original Mortgage
$225,623
Interest Rate
6.19%
Mortgage Type
VA
Purchase Details
Closed on
Feb 8, 2006
Sold by
Curb South Llc
Bought by
Artistic Homes Inc
Home Financials for this Owner
Home Financials are based on the most recent Mortgage that was taken out on this home.
Original Mortgage
$225,623
Interest Rate
6.19%
Mortgage Type
VA
Create a Home Valuation Report for This Property
The Home Valuation Report is an in-depth analysis detailing your home's value as well as a comparison with similar homes in the area
Home Values in the Area
Average Home Value in this Area
Purchase History
| Date | Buyer | Sale Price | Title Company |
|---|---|---|---|
| Pluemer Greg | -- | None Listed On Document | |
| Pluemer Greg | -- | None Listed On Document | |
| Secertary Of Veterans Affairs | -- | Old Republic Title Company | |
| Bokf Na | -- | None Available | |
| Ashton Scot A | -- | None Available | |
| Artistic Homes Inc | -- | None Available |
Source: Public Records
Mortgage History
| Date | Status | Borrower | Loan Amount |
|---|---|---|---|
| Previous Owner | Ashton Scot A | $225,623 |
Source: Public Records
Tax History Compared to Growth
Tax History
| Year | Tax Paid | Tax Assessment Tax Assessment Total Assessment is a certain percentage of the fair market value that is determined by local assessors to be the total taxable value of land and additions on the property. | Land | Improvement |
|---|---|---|---|---|
| 2025 | $2,198 | $56,276 | $14,609 | $41,667 |
| 2024 | $1,809 | $54,637 | $12,970 | $41,667 |
| 2023 | $1,745 | $53,045 | $11,378 | $41,667 |
| 2022 | $1,716 | $51,500 | $8,583 | $42,917 |
| 2021 | $1,732 | $51,500 | $8,583 | $42,917 |
| 2020 | $1,714 | $50,000 | $8,333 | $41,667 |
| 2019 | $1,724 | $50,000 | $8,333 | $41,667 |
| 2018 | $1,694 | $50,000 | $8,333 | $41,667 |
| 2017 | $1,668 | $50,000 | $8,333 | $41,667 |
| 2016 | $1,670 | $50,000 | $8,333 | $41,667 |
| 2015 | -- | $50,000 | $8,333 | $41,667 |
| 2013 | -- | $76,295 | $10,482 | $65,813 |
| 2011 | -- | $222,219 | $30,531 | $191,688 |
Source: Public Records
Map
Nearby Homes
- 191 Open Range Ave SW
- 3461 Lonetree St SW
- 241 Big Sky Ave SW
- 680 Purple Aster Ave SW
- 2981 Desert Sage Ave SW
- 750 Creekside Ave SW
- 3787 Tayrien Ct SW
- 3700 Santa fe Trail SW
- 3640 Santa fe Trail SW
- 471 Chafey Dr SW
- 3291 Prairie Sage St SW
- 3271 Prairie Ridge St SW
- 3580 Santa fe Trail SW
- Sandia Plan at The Trails at El Cerro
- Bandera Plan at The Trails at El Cerro
- Manzano Plan at The Trails at El Cerro
- Alameda Plan at The Trails at El Cerro
- 3601 Santa fe Trail SW
- 460 Rio Chama Cir SW
- 440 Rio Chama Cir SW
- 280 Open Range Ave SW
- 290 Open Range Ave SW
- 290 Open Range Ave SW Unit 12
- 270 Open Range Ave SW
- 300 Open Range Ave SW
- 255 Cloud View Ave SW Unit 1
- 255 Cloud View Ave SW
- 235 Cloud View Ave SW
- 275 Cloud View Ave SW
- 275 Cloud View Ave SW Unit 1
- 215 Cloud View Ave SW
- 291 Open Range Ave SW
- 291 Open Range Ave SW Unit 1
- 301 Open Range Ave SW
- 310 Open Range Ave SW
- 271 Open Range Ave SW
- 311 Open Range Ave SW
- 311 Open Range Ave SW Unit 1
- 295 Cloud View Ave SW
- 251 Open Range Ave SW