Estimated Value: $288,000 - $569,000
3
Beds
2
Baths
1,325
Sq Ft
$371/Sq Ft
Est. Value
About This Home
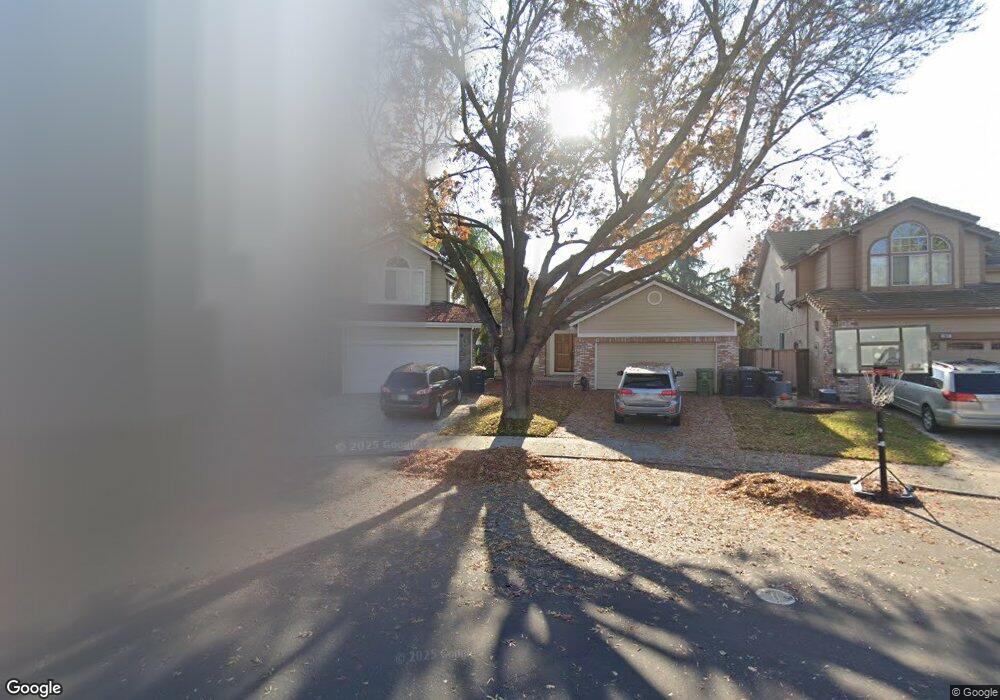
This home is located at 280 Orestimba Cir, Tracy, CA 95376 and is currently estimated at $491,221, approximately $370 per square foot. 280 Orestimba Cir is a home located in San Joaquin County with nearby schools including Louis A. Bohn Elementary School, Earle E. Williams Middle School, and Tracy High School.
Ownership History
Date
Name
Owned For
Owner Type
Purchase Details
Closed on
Oct 8, 2001
Sold by
Hoock Robert F
Bought by
Hoock Robert F and Hoock Robyn D
Current Estimated Value
Home Financials for this Owner
Home Financials are based on the most recent Mortgage that was taken out on this home.
Original Mortgage
$193,000
Outstanding Balance
$75,492
Interest Rate
6.88%
Estimated Equity
$415,729
Purchase Details
Closed on
Aug 11, 1999
Sold by
Trujillo Robert and Hoock Robert F
Bought by
Hoock Robert F
Home Financials for this Owner
Home Financials are based on the most recent Mortgage that was taken out on this home.
Original Mortgage
$148,000
Interest Rate
7.63%
Mortgage Type
Stand Alone First
Purchase Details
Closed on
Apr 29, 1997
Sold by
Hopper Barbara A
Bought by
Trujillo Robert
Home Financials for this Owner
Home Financials are based on the most recent Mortgage that was taken out on this home.
Original Mortgage
$123,120
Interest Rate
8.15%
Create a Home Valuation Report for This Property
The Home Valuation Report is an in-depth analysis detailing your home's value as well as a comparison with similar homes in the area
Home Values in the Area
Average Home Value in this Area
Purchase History
| Date | Buyer | Sale Price | Title Company |
|---|---|---|---|
| Hoock Robert F | -- | Chicago Title Co | |
| Hoock Robert F | -- | First American Title Guarant | |
| Trujillo Robert | $154,000 | Fidelity National Title Co |
Source: Public Records
Mortgage History
| Date | Status | Borrower | Loan Amount |
|---|---|---|---|
| Open | Hoock Robert F | $193,000 | |
| Closed | Hoock Robert F | $148,000 | |
| Closed | Trujillo Robert | $123,120 |
Source: Public Records
Tax History
| Year | Tax Paid | Tax Assessment Tax Assessment Total Assessment is a certain percentage of the fair market value that is determined by local assessors to be the total taxable value of land and additions on the property. | Land | Improvement |
|---|---|---|---|---|
| 2025 | $3,075 | $253,944 | $81,426 | $172,518 |
| 2024 | $2,843 | $248,966 | $79,830 | $169,136 |
| 2023 | $2,795 | $244,085 | $78,265 | $165,820 |
| 2022 | $2,735 | $239,300 | $76,731 | $162,569 |
| 2021 | $2,698 | $234,609 | $75,227 | $159,382 |
| 2020 | $2,678 | $232,204 | $74,456 | $157,748 |
| 2019 | $2,632 | $227,652 | $72,997 | $154,655 |
| 2018 | $2,826 | $223,189 | $71,566 | $151,623 |
| 2017 | $2,700 | $218,813 | $70,163 | $148,650 |
| 2016 | $2,717 | $214,524 | $68,788 | $145,736 |
| 2014 | $2,569 | $207,164 | $66,428 | $140,736 |
Source: Public Records
Map
Nearby Homes
- 243 E 3rd St
- 60 W South St
- 166 Norman Ct
- 320 Accipiter Ct
- 515 Peerless Way Unit 13
- 430 Czerny St
- 1110 Amaretto Dr
- 145 Machado Ct
- 25820 S Macarthur Dr
- 448 Burlington Dr
- 18 W 8th St
- 1624 Badger Way
- 1555 Tahoe Cir
- 181 W Willow Creek Dr
- 1660 Tahoe Cir
- 125 E 12th St
- 920 Taft Ave
- 206 W 12th St
- 2055 Tahoe Cir
- 319 W 12th St
- 270 Orestimba Cir
- 285 Tassajera Ct
- 260 Orestimba Cir
- 275 Tassajera Ct
- 265 Tassajera Ct
- 250 Orestimba Cir
- 285 Orestimba Cir
- 275 Orestimba Cir
- 255 Tassajera Ct
- 265 Orestimba Cir
- 230 Orestimba Cir
- 255 Orestimba Cir
- 410 Altamont Dr
- 235 Tassajera Ct
- 245 Orestimba Cir
- 280 Mount Hamilton Dr
- 280 Tassajera Ct
- 270 Mount Hamilton Dr
- 270 Tassajera Ct
- 430 Altamont Dr