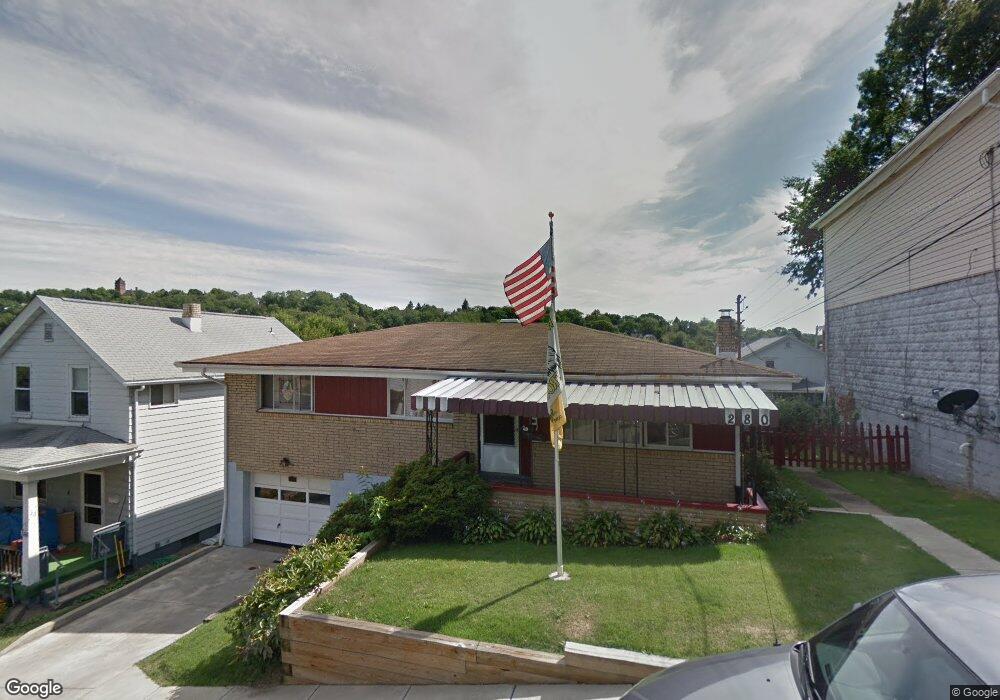
280 Paul St Pittsburgh, PA 15211
Mount Washington NeighborhoodEstimated Value: $109,000 - $186,000
3
Beds
2
Baths
864
Sq Ft
$183/Sq Ft
Est. Value
About This Home
This home is located at 280 Paul St, Pittsburgh, PA 15211 and is currently estimated at $158,000, approximately $182 per square foot. 280 Paul St is a home located in Allegheny County with nearby schools including Pittsburgh Whittier K-5, South Hills Middle School, and Pittsburgh Brashear High School.
Ownership History
Date
Name
Owned For
Owner Type
Purchase Details
Closed on
Sep 17, 2012
Sold by
Sexton Virginia D
Bought by
Wuenstel Philip O
Current Estimated Value
Home Financials for this Owner
Home Financials are based on the most recent Mortgage that was taken out on this home.
Original Mortgage
$112,000
Outstanding Balance
$77,499
Interest Rate
3.57%
Mortgage Type
New Conventional
Estimated Equity
$80,501
Purchase Details
Closed on
May 1, 1985
Bought by
Lewis George E and Lewis Catherine
Create a Home Valuation Report for This Property
The Home Valuation Report is an in-depth analysis detailing your home's value as well as a comparison with similar homes in the area
Home Values in the Area
Average Home Value in this Area
Purchase History
| Date | Buyer | Sale Price | Title Company |
|---|---|---|---|
| Wuenstel Philip O | $47,000 | -- | |
| Lewis George E | $42,000 | -- |
Source: Public Records
Mortgage History
| Date | Status | Borrower | Loan Amount |
|---|---|---|---|
| Open | Wuenstel Philip O | $112,000 |
Source: Public Records
Tax History Compared to Growth
Tax History
| Year | Tax Paid | Tax Assessment Tax Assessment Total Assessment is a certain percentage of the fair market value that is determined by local assessors to be the total taxable value of land and additions on the property. | Land | Improvement |
|---|---|---|---|---|
| 2025 | $1,523 | $66,100 | $18,000 | $48,100 |
| 2024 | $1,523 | $66,100 | $18,000 | $48,100 |
| 2023 | $1,523 | $66,100 | $18,000 | $48,100 |
| 2022 | $1,503 | $66,100 | $18,000 | $48,100 |
| 2021 | $1,520 | $66,100 | $18,000 | $48,100 |
| 2020 | $1,496 | $66,100 | $18,000 | $48,100 |
| 2019 | $1,496 | $66,100 | $18,000 | $48,100 |
| 2018 | $1,200 | $66,100 | $18,000 | $48,100 |
| 2017 | $1,496 | $66,100 | $18,000 | $48,100 |
| 2016 | $313 | $66,100 | $18,000 | $48,100 |
| 2015 | $313 | $66,100 | $18,000 | $48,100 |
| 2014 | $1,463 | $66,100 | $18,000 | $48,100 |
Source: Public Records
Map
Nearby Homes