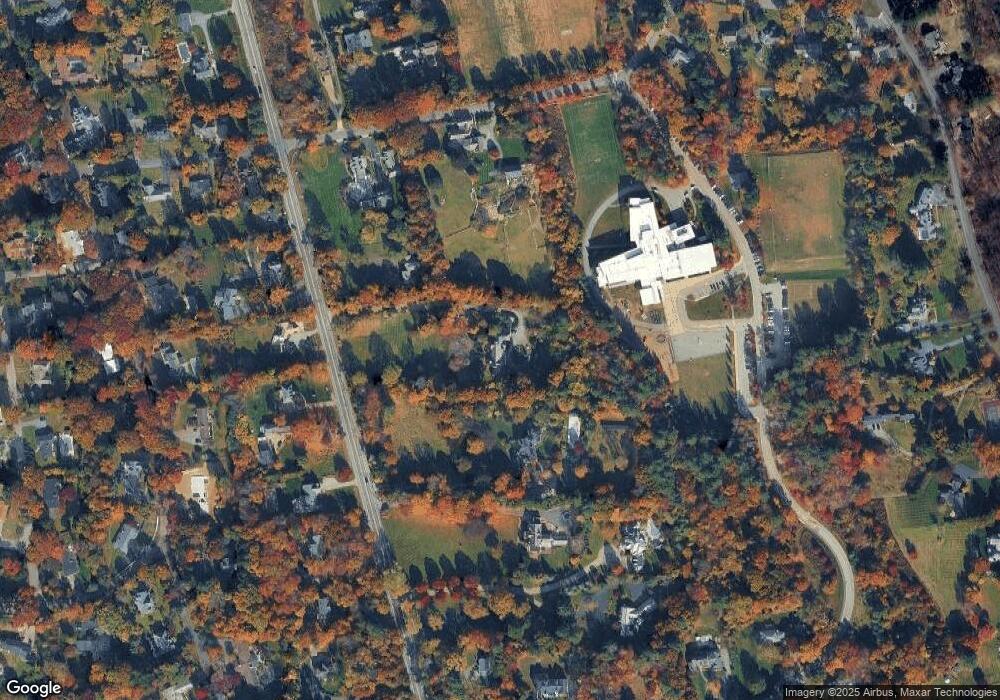
280 S Main St Andover, MA 01810
Phillips Academy NeighborhoodEstimated Value: $2,322,000 - $5,102,000
7
Beds
6
Baths
14,000
Sq Ft
$245/Sq Ft
Est. Value
About This Home
This home is located at 280 S Main St, Andover, MA 01810 and is currently estimated at $3,424,834, approximately $244 per square foot. 280 S Main St is a home located in Essex County with nearby schools including Bancroft Elementary School, Doherty Middle School, and Andover High School.
Ownership History
Date
Name
Owned For
Owner Type
Purchase Details
Closed on
Nov 6, 2000
Sold by
Mraigae Rt and Morello Dominic
Bought by
Greencourt Rt and Willis Dana
Current Estimated Value
Purchase Details
Closed on
Aug 12, 1994
Sold by
Brown Gladys A
Bought by
Greencourt Rt
Create a Home Valuation Report for This Property
The Home Valuation Report is an in-depth analysis detailing your home's value as well as a comparison with similar homes in the area
Home Values in the Area
Average Home Value in this Area
Purchase History
| Date | Buyer | Sale Price | Title Company |
|---|---|---|---|
| Greencourt Rt | $200,000 | -- | |
| Greencourt Rt | $283,333 | -- |
Source: Public Records
Mortgage History
| Date | Status | Borrower | Loan Amount |
|---|---|---|---|
| Open | Greencourt Rt | $1,000,000 | |
| Previous Owner | Greencourt Rt | $950,000 | |
| Previous Owner | Greencourt Rt | $650,000 |
Source: Public Records
Tax History
| Year | Tax Paid | Tax Assessment Tax Assessment Total Assessment is a certain percentage of the fair market value that is determined by local assessors to be the total taxable value of land and additions on the property. | Land | Improvement |
|---|---|---|---|---|
| 2024 | $42,586 | $3,306,400 | $1,246,900 | $2,059,500 |
| 2023 | $41,043 | $3,004,600 | $1,155,900 | $1,848,700 |
| 2022 | $38,272 | $2,621,400 | $981,200 | $1,640,200 |
| 2021 | $36,580 | $2,392,400 | $893,500 | $1,498,900 |
| 2020 | $35,071 | $2,336,500 | $872,000 | $1,464,500 |
| 2019 | $0 | $2,271,500 | $847,200 | $1,424,300 |
| 2018 | $0 | $2,102,700 | $800,000 | $1,302,700 |
| 2017 | $0 | $2,074,900 | $784,300 | $1,290,600 |
| 2016 | -- | $2,074,900 | $784,300 | $1,290,600 |
| 2015 | -- | $1,966,300 | $754,500 | $1,211,800 |
Source: Public Records
Map
Nearby Homes
Your Personal Tour Guide
Ask me questions while you tour the home.