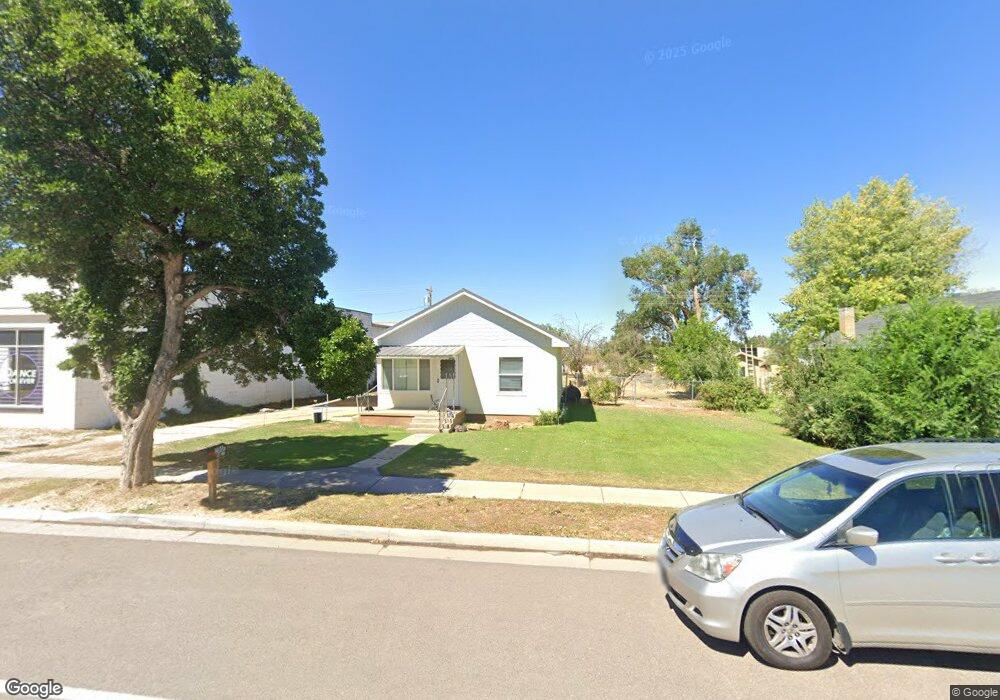
280 S Main St Fillmore, UT 84631
Estimated Value: $191,825 - $377,000
3
Beds
2
Baths
1,341
Sq Ft
$211/Sq Ft
Est. Value
About This Home
This home is located at 280 S Main St, Fillmore, UT 84631 and is currently estimated at $283,206, approximately $211 per square foot. 280 S Main St is a home located in Millard County.
Ownership History
Date
Name
Owned For
Owner Type
Purchase Details
Closed on
Sep 14, 2023
Sold by
Ga Proper Investments Ltd
Bought by
Rna Investments Llc
Current Estimated Value
Create a Home Valuation Report for This Property
The Home Valuation Report is an in-depth analysis detailing your home's value as well as a comparison with similar homes in the area
Home Values in the Area
Average Home Value in this Area
Purchase History
| Date | Buyer | Sale Price | Title Company |
|---|---|---|---|
| Rna Investments Llc | -- | First American Title Insurance | |
| Ga Roper Investments Ltd Limited Partnership | -- | First American Title Insurance |
Source: Public Records
Tax History
| Year | Tax Paid | Tax Assessment Tax Assessment Total Assessment is a certain percentage of the fair market value that is determined by local assessors to be the total taxable value of land and additions on the property. | Land | Improvement |
|---|---|---|---|---|
| 2025 | $815 | $102,344 | $26,267 | $76,077 |
| 2024 | $815 | $77,264 | $20,754 | $56,510 |
| 2023 | $883 | $77,264 | $20,754 | $56,510 |
| 2022 | $678 | $60,909 | $18,867 | $42,042 |
| 2021 | $572 | $49,288 | $12,251 | $37,037 |
| 2020 | $528 | $45,773 | $11,138 | $34,635 |
| 2019 | $460 | $39,979 | $11,138 | $28,841 |
| 2018 | $440 | $39,166 | $11,138 | $28,028 |
| 2017 | $351 | $29,672 | $10,890 | $18,782 |
| 2016 | $335 | $29,672 | $10,890 | $18,782 |
| 2015 | $335 | $29,672 | $10,890 | $18,782 |
| 2014 | -- | $29,672 | $10,890 | $18,782 |
| 2013 | -- | $29,672 | $10,890 | $18,782 |
Source: Public Records
Map
Nearby Homes
- 465 S 100 W
- 190 W 400 St S
- 190 S 200 W
- 235 S 200 St E
- 40 S 100 Rd E
- 155 E 500 St S
- 157 E 500 South St
- 290 W 200 S
- 155 W Center St
- 351 W 100 South St
- 75 N 100 West St
- 405 E 500 St S
- 430 E Canyon Rd
- 310 S 500 West Rd
- 225 W 200 St N
- 760 E 700 St S
- 245 W 300 N
- 690 E 500 S
- 390 N 100 W
- 750 800 South Fillmore
Your Personal Tour Guide
Ask me questions while you tour the home.