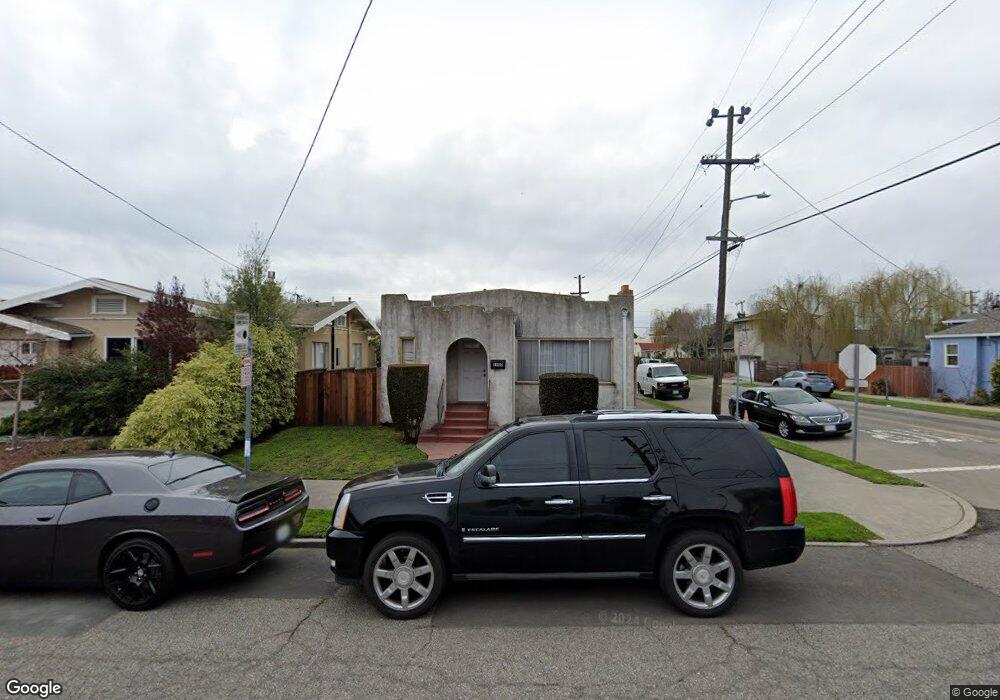
2800 Dohr St Berkeley, CA 94702
West Berkeley NeighborhoodEstimated Value: $782,799 - $1,007,000
Studio
--
Bath
1,412
Sq Ft
$654/Sq Ft
Est. Value
About This Home
This home is located at 2800 Dohr St, Berkeley, CA 94702 and is currently estimated at $923,700, approximately $654 per square foot. 2800 Dohr St is a home located in Alameda County with nearby schools including Malcolm X Elementary School, Washington Elementary School, and Oxford Elementary School.
Ownership History
Date
Name
Owned For
Owner Type
Purchase Details
Closed on
Jul 10, 2018
Sold by
Watkins Althea B and Watkins Brian E
Bought by
Watkins Brian E and Watkins Althea B
Current Estimated Value
Home Financials for this Owner
Home Financials are based on the most recent Mortgage that was taken out on this home.
Original Mortgage
$427,650
Interest Rate
4.5%
Mortgage Type
New Conventional
Purchase Details
Closed on
Dec 2, 2015
Sold by
Watkins Althea B and Johnson Althea B
Bought by
Watkins Althea B and Watkins Brian
Create a Home Valuation Report for This Property
The Home Valuation Report is an in-depth analysis detailing your home's value as well as a comparison with similar homes in the area
Home Values in the Area
Average Home Value in this Area
Purchase History
| Date | Buyer | Sale Price | Title Company |
|---|---|---|---|
| Watkins Brian E | -- | First American Title Company | |
| Watkins Althea B | -- | None Available |
Source: Public Records
Mortgage History
| Date | Status | Borrower | Loan Amount |
|---|---|---|---|
| Closed | Watkins Brian E | $427,650 |
Source: Public Records
Tax History
| Year | Tax Paid | Tax Assessment Tax Assessment Total Assessment is a certain percentage of the fair market value that is determined by local assessors to be the total taxable value of land and additions on the property. | Land | Improvement |
|---|---|---|---|---|
| 2025 | $4,305 | $54,183 | $33,834 | $20,349 |
| 2024 | $4,305 | $53,121 | $33,171 | $19,950 |
| 2023 | $4,137 | $52,079 | $32,520 | $19,559 |
| 2022 | $4,161 | $51,059 | $31,883 | $19,176 |
| 2021 | $4,126 | $50,058 | $31,258 | $18,800 |
| 2020 | $3,835 | $49,544 | $30,937 | $18,607 |
| 2019 | $3,583 | $48,573 | $30,331 | $18,242 |
| 2018 | $3,466 | $47,621 | $29,736 | $17,885 |
| 2017 | $3,309 | $46,687 | $29,153 | $17,534 |
| 2016 | $3,099 | $45,772 | $28,582 | $17,190 |
| 2015 | $3,029 | $45,084 | $28,152 | $16,932 |
| 2014 | $3,040 | $44,201 | $27,601 | $16,600 |
Source: Public Records
Map
Nearby Homes
- 2790 Sacramento St
- 2782 Sacramento St
- 2774 Sacramento St
- 2717 Mabel St
- 2758 Sacramento St
- 1450 Ward St
- 2750 Sacramento St
- 2922 Stanton St
- 1314 Ashby Ave
- 1515 Derby St
- 1237 Ashby Ave
- 1535 Julia St
- 2829 California St
- 3032 Mabel St
- 1034 Grayson St
- 1507 Prince St
- 1135 Parker St
- 1010 Grayson St
- 3101 Sacramento St
- 1612 Parker St
Your Personal Tour Guide
Ask me questions while you tour the home.