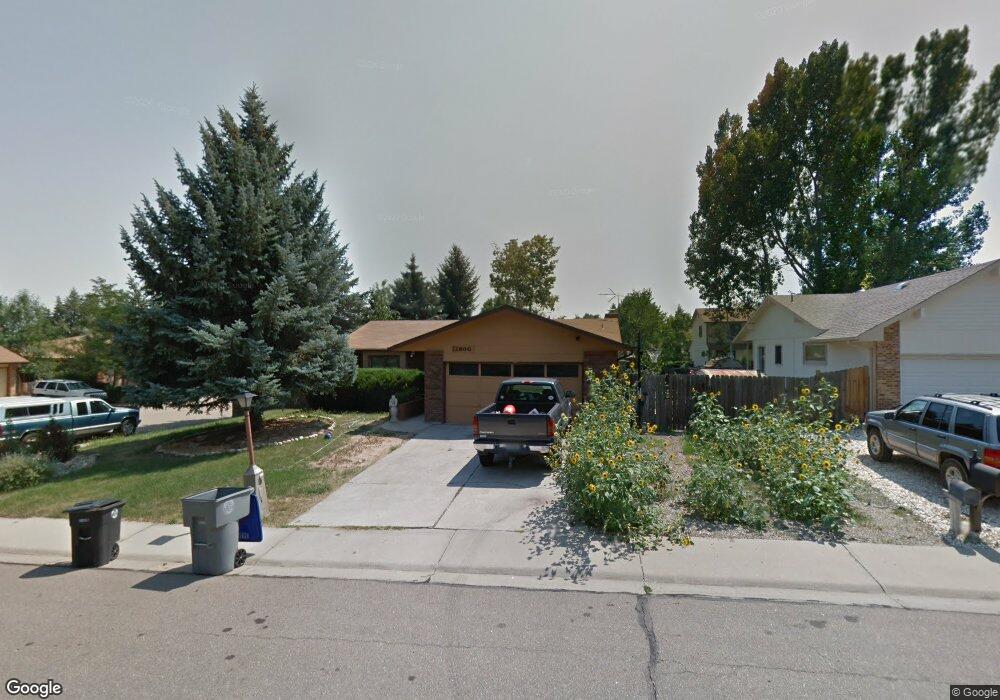
2800 Humboldt Place Longmont, CO 80503
Longmont Estates NeighborhoodEstimated Value: $539,611 - $593,000
3
Beds
3
Baths
2,464
Sq Ft
$229/Sq Ft
Est. Value
About This Home
This home is located at 2800 Humboldt Place, Longmont, CO 80503 and is currently estimated at $563,153, approximately $228 per square foot. 2800 Humboldt Place is a home located in Boulder County with nearby schools including Longmont Estates Elementary School, Westview Middle School, and Silver Creek High School.
Ownership History
Date
Name
Owned For
Owner Type
Purchase Details
Closed on
May 16, 2016
Sold by
Scott Douglas T and Scott Amanda J
Bought by
Denn Taylor A
Current Estimated Value
Home Financials for this Owner
Home Financials are based on the most recent Mortgage that was taken out on this home.
Original Mortgage
$279,000
Outstanding Balance
$222,464
Interest Rate
3.71%
Mortgage Type
New Conventional
Estimated Equity
$340,689
Purchase Details
Closed on
Dec 14, 2006
Sold by
Tompkins Dudley H
Bought by
Scott Douglas T and Scott Amanda J
Home Financials for this Owner
Home Financials are based on the most recent Mortgage that was taken out on this home.
Original Mortgage
$153,562
Interest Rate
6.3%
Mortgage Type
Purchase Money Mortgage
Purchase Details
Closed on
Jan 6, 1988
Bought by
Denn Taylor A
Purchase Details
Closed on
Nov 3, 1982
Bought by
Denn Taylor A
Purchase Details
Closed on
Jul 27, 1982
Bought by
Denn Taylor A
Create a Home Valuation Report for This Property
The Home Valuation Report is an in-depth analysis detailing your home's value as well as a comparison with similar homes in the area
Home Values in the Area
Average Home Value in this Area
Purchase History
| Date | Buyer | Sale Price | Title Company |
|---|---|---|---|
| Denn Taylor A | $310,000 | Fntc | |
| Scott Douglas T | $204,750 | None Available | |
| Denn Taylor A | $93,000 | -- | |
| Denn Taylor A | $77,300 | -- | |
| Denn Taylor A | $17,000 | -- |
Source: Public Records
Mortgage History
| Date | Status | Borrower | Loan Amount |
|---|---|---|---|
| Open | Denn Taylor A | $279,000 | |
| Previous Owner | Scott Douglas T | $153,562 |
Source: Public Records
Tax History Compared to Growth
Tax History
| Year | Tax Paid | Tax Assessment Tax Assessment Total Assessment is a certain percentage of the fair market value that is determined by local assessors to be the total taxable value of land and additions on the property. | Land | Improvement |
|---|---|---|---|---|
| 2025 | $3,279 | $34,738 | $9,413 | $25,325 |
| 2024 | $3,279 | $34,738 | $9,413 | $25,325 |
| 2023 | $3,235 | $34,284 | $10,506 | $27,463 |
| 2022 | $2,862 | $28,926 | $8,097 | $20,829 |
| 2021 | $2,900 | $29,759 | $8,330 | $21,429 |
| 2020 | $2,487 | $25,604 | $6,721 | $18,883 |
| 2019 | $2,448 | $25,604 | $6,721 | $18,883 |
| 2018 | $2,218 | $23,350 | $6,768 | $16,582 |
| 2017 | $2,188 | $25,814 | $7,482 | $18,332 |
| 2016 | $2,036 | $21,301 | $9,074 | $12,227 |
| 2015 | $1,940 | $16,947 | $4,378 | $12,569 |
| 2014 | $1,682 | $16,947 | $4,378 | $12,569 |
Source: Public Records
Map
Nearby Homes
- 2810 Humboldt Cir
- 2871 Humboldt Cir
- 2888 Humboldt Cir
- 2623 Elmhurst Cir
- 1448 Elmhurst Ct
- 1429 Auburn Ct
- 1379 Charles Dr Unit 7
- 1379 Charles Dr Unit 4
- 1379 Charles Dr Unit 5
- 1379 Charles Dr Unit 3
- 1345 Northwestern Rd
- 1506 Fisk Ct
- 1451 Elmhurst Dr
- 1440 Northwestern Rd
- 1221 Kiteley Ln
- 1460 Belmont Dr
- 2325 15th Ave
- 28 University Dr
- 1106 Purdue Dr
- 1262 Lanyon Ln
- 2806 Humboldt Place
- 2822 Humboldt Cir
- 2818 Humboldt Cir
- 2812 Humboldt Place
- 2843 Humboldt Cir
- 2801 Humboldt Place
- 2839 Humboldt Cir
- 2847 Humboldt Cir
- 2807 Humboldt Place
- 2814 Humboldt Cir
- 2835 Humboldt Cir
- 2851 Humboldt Cir
- 2813 Humboldt Place
- 2816 Humboldt Place
- 2823 Humboldt Cir
- 2827 Humboldt Cir
- 2868 Humboldt Cir
- 2855 Humboldt Cir
- 2819 Humboldt Cir
- 2872 Humboldt Cir