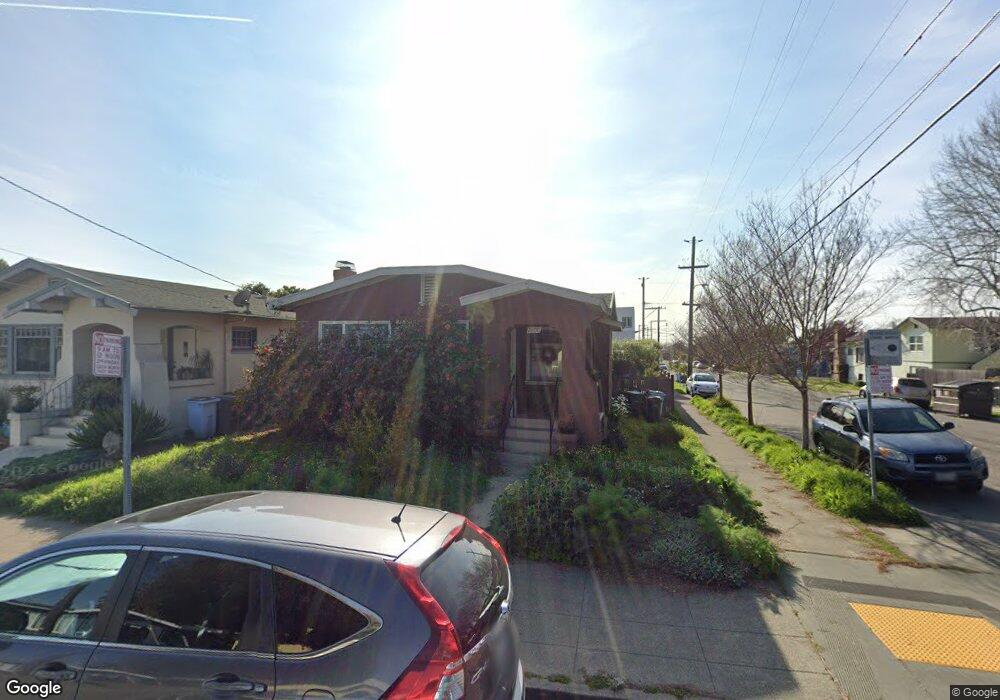
2800 Stanton St Berkeley, CA 94702
West Berkeley NeighborhoodEstimated Value: $913,166 - $1,103,000
2
Beds
1
Bath
1,076
Sq Ft
$955/Sq Ft
Est. Value
About This Home
This home is located at 2800 Stanton St, Berkeley, CA 94702 and is currently estimated at $1,027,542, approximately $954 per square foot. 2800 Stanton St is a home located in Alameda County with nearby schools including Malcolm X Elementary School, Washington Elementary School, and Oxford Elementary School.
Ownership History
Date
Name
Owned For
Owner Type
Purchase Details
Closed on
Aug 15, 2013
Sold by
Hollins Lyman M
Bought by
Christian Church Disciples Of Christ Of
Current Estimated Value
Purchase Details
Closed on
Feb 18, 2004
Sold by
Johnson Paula D and The Velma Davenport Revocable
Bought by
Hollins Lyman M
Home Financials for this Owner
Home Financials are based on the most recent Mortgage that was taken out on this home.
Original Mortgage
$320,000
Interest Rate
5.62%
Mortgage Type
Purchase Money Mortgage
Purchase Details
Closed on
May 17, 2001
Sold by
Davenport Velma
Bought by
Johnson Paula D and Velma Davenport Revocable Trus
Home Financials for this Owner
Home Financials are based on the most recent Mortgage that was taken out on this home.
Original Mortgage
$137,500
Interest Rate
6.97%
Mortgage Type
Stand Alone First
Purchase Details
Closed on
May 14, 2001
Sold by
Dillard Kevien D and Dillard Kevin
Bought by
Davenport Velma L
Home Financials for this Owner
Home Financials are based on the most recent Mortgage that was taken out on this home.
Original Mortgage
$137,500
Interest Rate
6.97%
Mortgage Type
Stand Alone First
Purchase Details
Closed on
Mar 21, 2001
Sold by
Davenport Velma L and Dillard Kevien D
Bought by
Dillard Kevien D
Home Financials for this Owner
Home Financials are based on the most recent Mortgage that was taken out on this home.
Original Mortgage
$137,500
Interest Rate
6.97%
Mortgage Type
Stand Alone First
Purchase Details
Closed on
May 1, 1998
Sold by
Davenport Velma L
Bought by
Davenport Velma L and Dillard Kevien D
Home Financials for this Owner
Home Financials are based on the most recent Mortgage that was taken out on this home.
Original Mortgage
$50,000
Interest Rate
7.05%
Purchase Details
Closed on
Feb 2, 1998
Sold by
Davenport Velma L
Bought by
Dillard Kevin and Brown Kirston
Create a Home Valuation Report for This Property
The Home Valuation Report is an in-depth analysis detailing your home's value as well as a comparison with similar homes in the area
Home Values in the Area
Average Home Value in this Area
Purchase History
| Date | Buyer | Sale Price | Title Company |
|---|---|---|---|
| Christian Church Disciples Of Christ Of | $575,000 | Placer Title Company | |
| Hollins Lyman M | $400,000 | Placer Title Company | |
| Johnson Paula D | -- | -- | |
| Davenport Velma L | -- | -- | |
| Davenport Velma L | -- | -- | |
| Dillard Kevien D | -- | Financial Title Company | |
| Dillard Kevien D | -- | Financial Title Company | |
| Davenport Velma L | $25,000 | Placer Title Company | |
| Dillard Kevin | -- | -- |
Source: Public Records
Mortgage History
| Date | Status | Borrower | Loan Amount |
|---|---|---|---|
| Previous Owner | Hollins Lyman M | $320,000 | |
| Previous Owner | Dillard Kevien D | $137,500 | |
| Previous Owner | Davenport Velma L | $50,000 | |
| Closed | Hollins Lyman M | $60,000 |
Source: Public Records
Tax History
| Year | Tax Paid | Tax Assessment Tax Assessment Total Assessment is a certain percentage of the fair market value that is determined by local assessors to be the total taxable value of land and additions on the property. | Land | Improvement |
|---|---|---|---|---|
| 2025 | $351 | $704,840 | $211,452 | $493,388 |
| 2024 | $351 | $691,023 | $207,307 | $483,716 |
| 2023 | $333 | $677,475 | $203,242 | $474,233 |
| 2022 | $304 | $0 | $199,258 | $464,935 |
| 2021 | $292 | $651,175 | $195,352 | $455,823 |
| 2020 | $284 | $644,500 | $193,350 | $451,150 |
| 2019 | $275 | $631,867 | $189,560 | $442,307 |
| 2018 | $263 | $619,481 | $185,844 | $433,637 |
| 2017 | $204 | $607,337 | $182,201 | $425,136 |
| 2016 | $8,461 | $595,428 | $178,628 | $416,800 |
| 2015 | $8,353 | $586,487 | $175,946 | $410,541 |
| 2014 | $8,308 | $575,000 | $172,500 | $402,500 |
Source: Public Records
Map
Nearby Homes
- 2790 Sacramento St
- 2782 Sacramento St
- 2774 Sacramento St
- 2758 Sacramento St
- 1450 Ward St
- 2750 Sacramento St
- 2922 Stanton St
- 2717 Mabel St
- 1515 Derby St
- 2829 California St
- 1535 Julia St
- 1314 Ashby Ave
- 2751 Wallace St
- 1612 Carleton St
- 1237 Ashby Ave
- 1612 Parker St
- 1507 Prince St
- 3032 Mabel St
- 3101 Sacramento St
- 1646 Ashby Ave
Your Personal Tour Guide
Ask me questions while you tour the home.