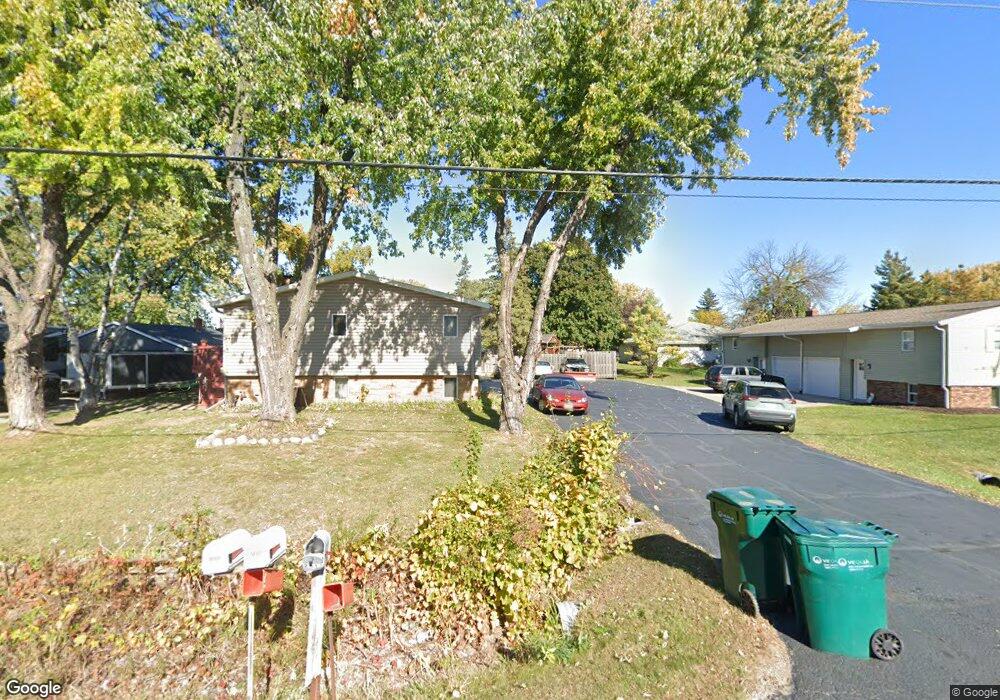
2800 W Spencer St Appleton, WI 54914
West Appleton NeighborhoodEstimated Value: $239,000 - $272,000
About This Home
Number of Bedrooms: 2
Number of Bathrooms: 1.5
Utilities included with rent: N/A
Utilities paid by tenant: All Utilities - Electric, Heat, Gas and Water.
Lawn Care and Snow Removal: Tenant Responsibility.
Pets: Sorry - No Pets.
Parking: Off Street/Garage Parking.
Laundry: Washer and Dryer Hookups On-Site.
Available August 1. 2 Bedroom, 1.5 Bath Duplex located close to schools, shopping, restaurants & downtown Appleton. Easy access to Highway 41. There are separate living and family rooms. The family room has a gas fireplace. The patio doors lead to a deck. There is a 1 car garage with opener. A maximum of 2 vehicles are allowed. This unit has central heating and air conditioning.
We complete a credit and background screening for all applicants who are 18 or over.
This is a 12 month lease. Three times the rent in gross monthly income and a minimum credit score of 625 is required. The security deposit is one months rent. No prior evictions.
Ownership History
Purchase Details
Purchase Details
Home Values in the Area
Average Home Value in this Area
Purchase History
| Date | Buyer | Sale Price | Title Company |
|---|---|---|---|
| Vancor Llc | $135,400 | -- | |
| Federal National Mortgage Association | $88,000 | -- |
Property History
| Date | Event | Price | List to Sale | Price per Sq Ft |
|---|---|---|---|---|
| 06/16/2025 06/16/25 | Off Market | $1,395 | -- | -- |
| 06/05/2025 06/05/25 | For Rent | $1,395 | -- | -- |
Tax History Compared to Growth
Tax History
| Year | Tax Paid | Tax Assessment Tax Assessment Total Assessment is a certain percentage of the fair market value that is determined by local assessors to be the total taxable value of land and additions on the property. | Land | Improvement |
|---|---|---|---|---|
| 2023 | $2,947 | $157,500 | $26,500 | $131,000 |
| 2022 | $2,811 | $157,500 | $26,500 | $131,000 |
| 2021 | $2,766 | $157,500 | $26,500 | $131,000 |
| 2020 | $2,831 | $157,500 | $26,500 | $131,000 |
| 2019 | $2,652 | $135,400 | $22,100 | $113,300 |
| 2018 | $2,737 | $135,400 | $22,100 | $113,300 |
| 2017 | $2,668 | $135,400 | $22,100 | $113,300 |
| 2016 | $2,709 | $135,400 | $22,100 | $113,300 |
| 2015 | $2,755 | $135,400 | $22,100 | $113,300 |
| 2014 | $2,834 | $140,300 | $22,100 | $118,200 |
| 2013 | $3,082 | $140,300 | $22,100 | $118,200 |
Map
- 825 S Olson Ave Unit F
- 83 Spencer Village Ct
- 65 Spencer Village Ct Unit 14
- 62 Spencer Village Ct
- 20 Spencer Village Ct
- 38 Spencer Village Ct Unit 1
- 9 Meadowbrook Ln
- 1712 S Seminole Rd
- 53 Weatherstone Dr
- 18 S Sunny Slope Ct
- 1517 W Rogers Ave
- 1400 W Prospect Ave
- 1326 W Spencer St
- 1717 S Connell St
- 2905 Fox Run
- 2755 Fox Run
- 1343 W Franklin St
- 511 S Mueller St
- 1119 W Lawrence St
- 2661 Northern Rd Unit I
- 1931 W Spencer St
- 22 Spencer Village Ct
- 24 Spencer Village Ct
- 30 Spencer Village Ct
- 36 Spencer Village Ct
- 2623 W 4th St
- 2740 W 4th St
- 2710 W 4th St
- 2715 W Spencer St
- 2711 W Spencer St
- 2701 W Spencer St
- 2645 W Spencer St
- 2641 W Spencer St
- 2718 W Spencer St
- 2640 W Spencer St
- 2526 W Spencer St
- 1913 W Spencer St
- 1930 W Spencer St
- 2820 W Spencer St
- 2804 W Spencer St