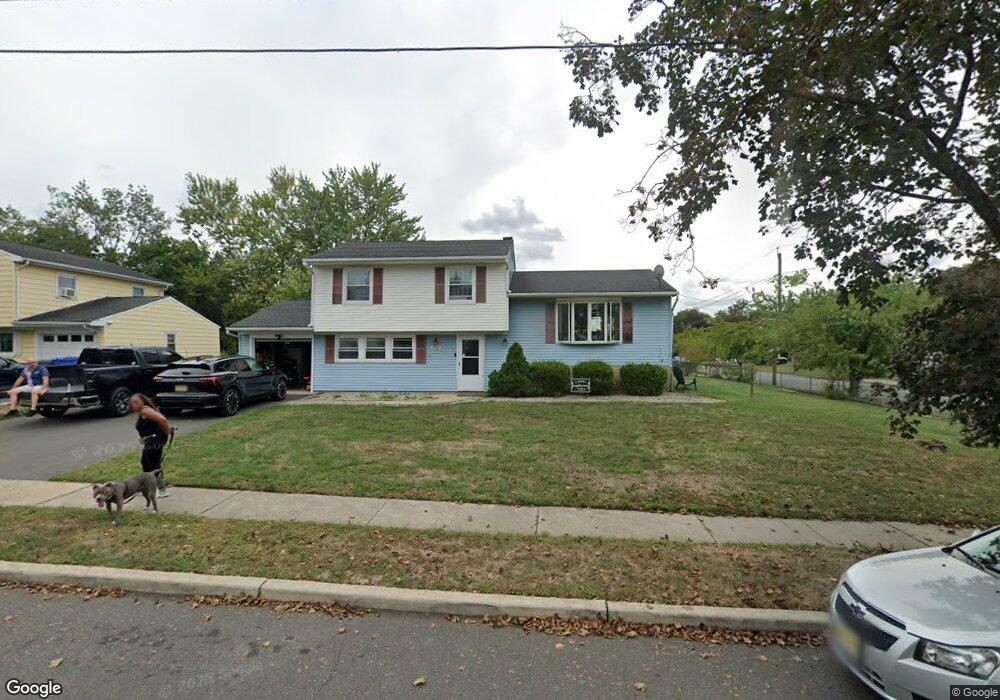
2800 Wade St Piscataway, NJ 08854
Estimated Value: $561,637 - $651,000
--
Bed
--
Bath
1,680
Sq Ft
$371/Sq Ft
Est. Value
About This Home
This home is located at 2800 Wade St, Piscataway, NJ 08854 and is currently estimated at $623,409, approximately $371 per square foot. 2800 Wade St is a home located in Middlesex County with nearby schools including Knollwood Elementary School, Martin Luther King Intermediate School, and Conackamack Middle School.
Ownership History
Date
Name
Owned For
Owner Type
Purchase Details
Closed on
Mar 20, 2018
Sold by
Clancio Domenica C
Bought by
Cianeio Tracie L
Current Estimated Value
Home Financials for this Owner
Home Financials are based on the most recent Mortgage that was taken out on this home.
Original Mortgage
$114,977
Outstanding Balance
$99,374
Interest Rate
4.75%
Mortgage Type
FHA
Estimated Equity
$524,035
Purchase Details
Closed on
Jan 16, 2018
Sold by
Larocca Rasquale and Larocca Christine
Bought by
Larocca Pasquale and Larocca Christine
Purchase Details
Closed on
Jun 16, 2016
Sold by
Larocca Pasquale and Larocca Christine
Bought by
Ciancio Tracie L and Ciancio Domenica C
Purchase Details
Closed on
Dec 24, 2015
Sold by
Larocca Pasquale and Larocca Christine
Bought by
Larocca Pasquale and Larocca Christine
Create a Home Valuation Report for This Property
The Home Valuation Report is an in-depth analysis detailing your home's value as well as a comparison with similar homes in the area
Home Values in the Area
Average Home Value in this Area
Purchase History
| Date | Buyer | Sale Price | Title Company |
|---|---|---|---|
| Cianeio Tracie L | -- | None Available | |
| Larocca Pasquale | -- | None Available | |
| Ciancio Tracie L | -- | None Available | |
| Larocca Pasquale | -- | None Available |
Source: Public Records
Mortgage History
| Date | Status | Borrower | Loan Amount |
|---|---|---|---|
| Open | Cianeio Tracie L | $114,977 |
Source: Public Records
Tax History Compared to Growth
Tax History
| Year | Tax Paid | Tax Assessment Tax Assessment Total Assessment is a certain percentage of the fair market value that is determined by local assessors to be the total taxable value of land and additions on the property. | Land | Improvement |
|---|---|---|---|---|
| 2025 | $7,945 | $458,400 | $283,700 | $174,700 |
| 2024 | $8,172 | $406,000 | $183,000 | $223,000 |
| 2023 | $8,172 | $391,000 | $183,000 | $208,000 |
| 2022 | $7,679 | $341,000 | $183,000 | $158,000 |
| 2021 | $7,597 | $324,400 | $183,000 | $141,400 |
| 2020 | $7,949 | $340,300 | $173,000 | $167,300 |
| 2019 | $7,301 | $307,300 | $173,000 | $134,300 |
| 2018 | $7,102 | $299,400 | $173,000 | $126,400 |
| 2017 | $7,521 | $274,400 | $148,000 | $126,400 |
| 2016 | $8,231 | $306,000 | $148,000 | $158,000 |
| 2015 | $8,115 | $306,000 | $148,000 | $158,000 |
| 2014 | $7,932 | $306,000 | $148,000 | $158,000 |
Source: Public Records
Map
Nearby Homes
- 532 Shirley Pkwy
- 308 Bound Brook Ave
- 606 Willow Ave
- 223 Elizabeth Ave
- 451 Hillside Ave
- 5114 Dey St
- 118 Plainfield Ave
- 400 Rivercrest Dr
- 23 Plainfield Ave
- 21 Buena Vista Ave
- 416 Elwood St
- 125 Park Ave
- 27 3rd Ave
- 226 Hanson Ave
- 6 Highland Ave
- 41 3rd Ave
- 19 4th Place
- 18 High Point Way
- 80 Mitchell Ave
- 26 Culver St
- 2808 Wade St
- 432 Shirley Pkwy
- 433 Ellis Pkwy
- 2801 Wade St
- 2712 Wade St
- 501 Ellis Pkwy
- 424 Shirley Pkwy
- 2713 Wade St
- 433 Shirley Pkwy
- 508 Shirley Pw
- 2704 Wade St
- 508 Shirley Pkwy
- 511 Ellis Pkwy
- 425 Shirley Pw
- 425 Shirley Pkwy
- 2705 Wade St
- 440 Ellis Pkwy
- 416 Shirley Pkwy
- 509 Shirley Pkwy
- 432 Ellis Pkwy