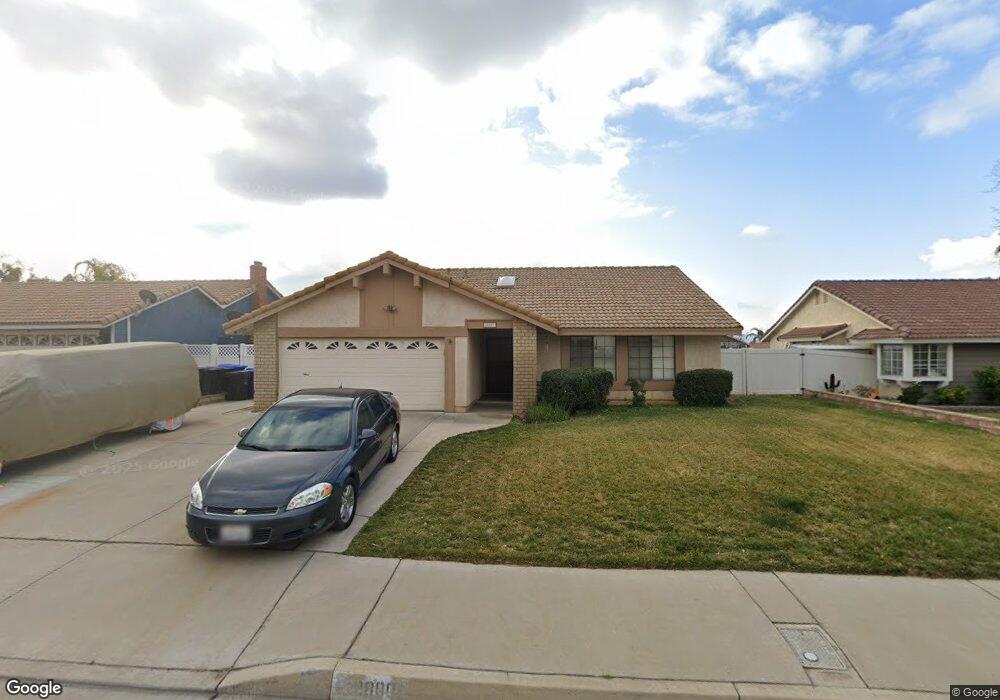
28009 Pasito St Highland, CA 92346
East Highlands NeighborhoodEstimated Value: $527,837 - $590,000
3
Beds
2
Baths
1,454
Sq Ft
$389/Sq Ft
Est. Value
About This Home
This home is located at 28009 Pasito St, Highland, CA 92346 and is currently estimated at $565,959, approximately $389 per square foot. 28009 Pasito St is a home located in San Bernardino County with nearby schools including Thompson Elementary School, Serrano Middle School, and San Gorgonio High School.
Ownership History
Date
Name
Owned For
Owner Type
Purchase Details
Closed on
Jun 20, 2019
Sold by
Files John M
Bought by
Files John M and The John M Files Family Trust
Current Estimated Value
Purchase Details
Closed on
Feb 18, 2016
Sold by
Files John M and Files John
Bought by
Files John M
Home Financials for this Owner
Home Financials are based on the most recent Mortgage that was taken out on this home.
Original Mortgage
$63,100
Outstanding Balance
$50,335
Interest Rate
3.97%
Mortgage Type
New Conventional
Estimated Equity
$515,624
Purchase Details
Closed on
Jul 17, 2009
Sold by
Files John
Bought by
Files John and Files Alice
Purchase Details
Closed on
Feb 25, 2009
Sold by
Winter Elsie L Leonhardt
Bought by
Files John
Purchase Details
Closed on
Jul 2, 1996
Sold by
Leonhardt Raymond R
Bought by
Leonhardt Raymond R and Leonhardt Elsie L
Create a Home Valuation Report for This Property
The Home Valuation Report is an in-depth analysis detailing your home's value as well as a comparison with similar homes in the area
Home Values in the Area
Average Home Value in this Area
Purchase History
| Date | Buyer | Sale Price | Title Company |
|---|---|---|---|
| Files John M | -- | None Available | |
| Files John M | -- | Chicago Title Company | |
| Files John | -- | None Available | |
| Files John | $250,500 | Stewart Title Company | |
| Leonhardt Raymond R | -- | -- |
Source: Public Records
Mortgage History
| Date | Status | Borrower | Loan Amount |
|---|---|---|---|
| Open | Files John M | $63,100 |
Source: Public Records
Tax History
| Year | Tax Paid | Tax Assessment Tax Assessment Total Assessment is a certain percentage of the fair market value that is determined by local assessors to be the total taxable value of land and additions on the property. | Land | Improvement |
|---|---|---|---|---|
| 2025 | $4,301 | $322,587 | $96,777 | $225,810 |
| 2024 | $4,211 | $316,261 | $94,879 | $221,382 |
| 2023 | $4,114 | $310,060 | $93,019 | $217,041 |
| 2022 | $4,118 | $303,980 | $91,195 | $212,785 |
| 2021 | $4,094 | $298,020 | $89,407 | $208,613 |
| 2020 | $4,095 | $294,964 | $88,490 | $206,474 |
| 2019 | $3,961 | $289,180 | $86,755 | $202,425 |
| 2018 | $3,861 | $283,510 | $85,054 | $198,456 |
| 2017 | $3,546 | $277,951 | $83,386 | $194,565 |
| 2016 | $3,439 | $272,501 | $81,751 | $190,750 |
| 2015 | $3,502 | $268,408 | $80,523 | $187,885 |
| 2014 | $3,404 | $263,151 | $78,946 | $184,205 |
Source: Public Records
Map
Nearby Homes
- 27989 Pacific St
- 28046 Millar St
- 1634 Seine Ave
- 28261 Cornus Ct
- 6886 Country Oaks Dr
- 1614 Buckeye St
- 7079 Cienega Dr
- 7001 Church Ave Unit 15
- 0 La Praix St
- 27631 Villa Ave
- 27611 Villa Ave
- 0 Baseline St Unit CV25136921
- 6986 Church Ave
- 27540 14th St
- 3734 Pacific St Unit 40
- 3850 Atlantic Ave Unit 287
- 3850 Atlantic Ave Unit 158
- 3850 Atlantic Ave Unit 151
- 3850 Atlantic Ave Unit 189
- 3850 Atlantic Ave Unit 152
- 28019 Pasito St
- 27999 Pasito St
- 28012 Pacific St
- 28002 Pacific St
- 28029 Pasito St
- 27989 Pasito St
- 28024 Pacific St
- 6846 Oleander Ave
- 27992 Pacific St
- 6853 Laurel Ave
- 28034 Pacific St
- 27982 Pacific St
- 28039 Pasito St
- 6838 Oleander Ave
- 6849 Oleander Ave
- 6841 Laurel Ave
- 28044 Pacific St
- 27965 Pasito St
- 28049 Pasito St
- 28009 Pacific St
Your Personal Tour Guide
Ask me questions while you tour the home.