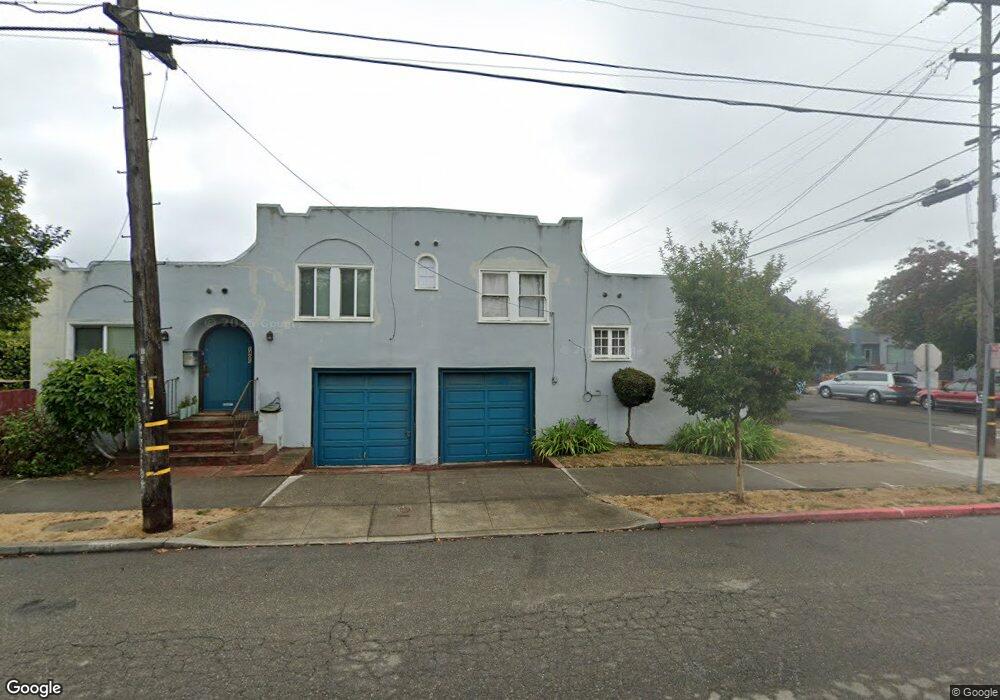
2801 Acton St Berkeley, CA 94702
West Berkeley NeighborhoodEstimated Value: $1,059,000 - $1,204,000
2
Beds
2
Baths
1,568
Sq Ft
$707/Sq Ft
Est. Value
About This Home
This home is located at 2801 Acton St, Berkeley, CA 94702 and is currently estimated at $1,109,180, approximately $707 per square foot. 2801 Acton St is a home located in Alameda County with nearby schools including Malcolm X Elementary School, Washington Elementary School, and Oxford Elementary School.
Ownership History
Date
Name
Owned For
Owner Type
Purchase Details
Closed on
Jan 13, 2025
Sold by
Covington Shirley Y
Bought by
Covington Family Trust and Covington
Current Estimated Value
Purchase Details
Closed on
Apr 27, 2015
Sold by
Covington Shirley Y and Covington Gail L
Bought by
Covington Shirley Y
Purchase Details
Closed on
Mar 27, 2015
Sold by
Covington Shirley Y and The Covington Family Trust
Bought by
Covington Shirley Y and Moore Monique G Covington
Purchase Details
Closed on
Jul 26, 2012
Sold by
Covington Benjamin G and Covington Shirley Y
Bought by
Covington Benjamin G and Covington Shirley Y
Create a Home Valuation Report for This Property
The Home Valuation Report is an in-depth analysis detailing your home's value as well as a comparison with similar homes in the area
Home Values in the Area
Average Home Value in this Area
Purchase History
| Date | Buyer | Sale Price | Title Company |
|---|---|---|---|
| Covington Family Trust | -- | None Listed On Document | |
| Covington Shirley Y | -- | None Available | |
| Covington Shirley Y | -- | None Available | |
| Covington Benjamin G | -- | None Available |
Source: Public Records
Tax History Compared to Growth
Tax History
| Year | Tax Paid | Tax Assessment Tax Assessment Total Assessment is a certain percentage of the fair market value that is determined by local assessors to be the total taxable value of land and additions on the property. | Land | Improvement |
|---|---|---|---|---|
| 2025 | $6,529 | $195,231 | $58,569 | $136,662 |
| 2024 | $6,529 | $191,403 | $57,421 | $133,982 |
| 2023 | $6,254 | $187,650 | $56,295 | $131,355 |
| 2022 | $5,968 | $183,971 | $55,191 | $128,780 |
| 2021 | $5,943 | $180,364 | $54,109 | $126,255 |
| 2020 | $5,567 | $178,515 | $53,554 | $124,961 |
| 2019 | $5,263 | $175,015 | $52,504 | $122,511 |
| 2018 | $5,123 | $171,584 | $51,475 | $120,109 |
| 2017 | $4,913 | $168,220 | $50,466 | $117,754 |
| 2016 | $4,663 | $164,922 | $49,476 | $115,446 |
| 2015 | $4,574 | $162,445 | $48,733 | $113,712 |
| 2014 | $4,578 | $159,263 | $47,779 | $111,484 |
Source: Public Records
Map
Nearby Homes
- 2728 Dohr St
- 2790 Sacramento St
- 2782 Sacramento St
- 2774 Sacramento St
- 2758 Sacramento St
- 1450 Ward St
- 2750 Sacramento St
- 2922 Stanton St
- 1540 Stuart St
- 2829 California St
- 1314 Ashby Ave
- 2703 Mathews St
- 1606 Derby St
- 1538 Ashby Ave
- 1525 Tyler St
- 1516 Blake St
- 1516 Blake St Unit A
- 1524 Blake St
- 3032 Mabel St
- 1612 Parker St
