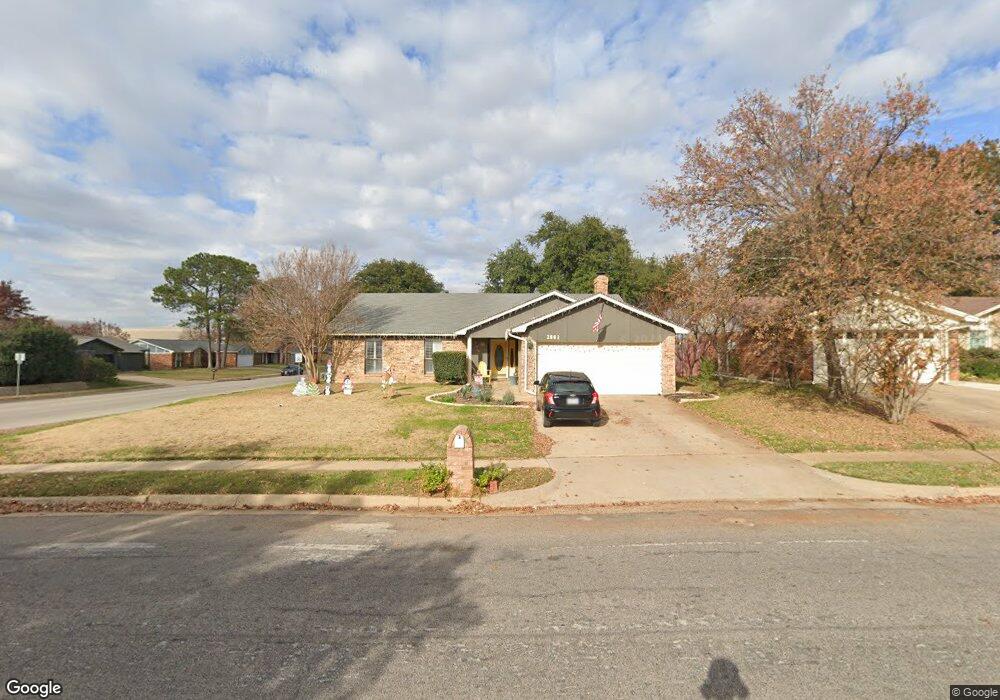
2801 Cummings Dr Bedford, TX 76021
Estimated Value: $365,232 - $428,000
3
Beds
2
Baths
1,731
Sq Ft
$228/Sq Ft
Est. Value
About This Home
This home is located at 2801 Cummings Dr, Bedford, TX 76021 and is currently estimated at $394,808, approximately $228 per square foot. 2801 Cummings Dr is a home located in Tarrant County with nearby schools including Spring Garden Elementary School, Harwood Junior High School, and Trinity High School.
Ownership History
Date
Name
Owned For
Owner Type
Purchase Details
Closed on
Sep 26, 2014
Sold by
Garza Diana E
Bought by
Addy Susan D
Current Estimated Value
Home Financials for this Owner
Home Financials are based on the most recent Mortgage that was taken out on this home.
Original Mortgage
$171,830
Outstanding Balance
$133,029
Interest Rate
4.37%
Mortgage Type
FHA
Estimated Equity
$261,779
Purchase Details
Closed on
Nov 22, 2002
Sold by
Ellis Alice Jeanette
Bought by
Garza Diana E
Home Financials for this Owner
Home Financials are based on the most recent Mortgage that was taken out on this home.
Original Mortgage
$108,000
Interest Rate
6.13%
Purchase Details
Closed on
Aug 21, 1996
Sold by
Prince Barry Steven and Prince Rebecca Riffel
Bought by
Ellis Alice Jeannette
Create a Home Valuation Report for This Property
The Home Valuation Report is an in-depth analysis detailing your home's value as well as a comparison with similar homes in the area
Home Values in the Area
Average Home Value in this Area
Purchase History
| Date | Buyer | Sale Price | Title Company |
|---|---|---|---|
| Addy Susan D | -- | None Available | |
| Garza Diana E | -- | American Title Co | |
| Ellis Alice Jeannette | -- | Rattikin Title Co |
Source: Public Records
Mortgage History
| Date | Status | Borrower | Loan Amount |
|---|---|---|---|
| Open | Addy Susan D | $171,830 | |
| Previous Owner | Garza Diana E | $108,000 | |
| Closed | Ellis Alice Jeannette | $0 |
Source: Public Records
Tax History Compared to Growth
Tax History
| Year | Tax Paid | Tax Assessment Tax Assessment Total Assessment is a certain percentage of the fair market value that is determined by local assessors to be the total taxable value of land and additions on the property. | Land | Improvement |
|---|---|---|---|---|
| 2025 | $5,453 | $345,749 | $70,000 | $275,749 |
| 2024 | $5,453 | $345,749 | $70,000 | $275,749 |
| 2023 | $6,187 | $368,834 | $45,000 | $323,834 |
| 2022 | $6,405 | $293,265 | $45,000 | $248,265 |
| 2021 | $6,653 | $285,833 | $45,000 | $240,833 |
| 2020 | $6,105 | $256,775 | $45,000 | $211,775 |
| 2019 | $6,101 | $266,500 | $45,000 | $221,500 |
| 2018 | $5,164 | $228,302 | $45,000 | $183,302 |
| 2017 | $5,021 | $217,498 | $30,000 | $187,498 |
| 2016 | $4,564 | $188,679 | $30,000 | $158,679 |
| 2015 | $3,730 | $174,713 | $30,000 | $144,713 |
| 2014 | $3,730 | $162,800 | $18,000 | $144,800 |
Source: Public Records
Map
Nearby Homes
- 3017 Bluebonnet Ln
- 3405 Scenic Hills Dr
- 3152 Woodbridge Dr
- 3721 Fieldcrest Ln
- 3024 Pecan Cir
- 3816 Rolling Meadows Dr
- 3001 Glenwood Ct
- 2600 Willow Bend
- 2709 Willow Bend
- 2609 Talisman Ct
- 3024 Highgate Ln
- 3013 Bent Tree Ln
- 2305 Meadowlark Ln
- 2616 Greenwood Ct
- 2922 Beachtree Ln
- Seaberry II Plan at Grace Park - Signature Series
- Primrose FE V Plan at Grace Park - Signature Series
- Hawthorne Plan at Grace Park - Signature Series
- Seaberry Plan at Grace Park - Signature Series
- Gardenia Plan at Grace Park - Signature Series
- 2805 Cummings Dr
- 2804 Bluebonnet Ln
- 2733 Cummings Dr
- 2809 Cummings Dr
- 2800 Cummings Dr
- 3401 Murphy Dr
- 2808 Bluebonnet Ln
- 2804 Cummings Dr
- 2813 Cummings Dr
- 2729 Cummings Dr
- 2808 Cummings Dr
- 3405 Murphy Dr
- 2812 Bluebonnet Ln
- 3300 Murphy Dr
- 2801 Bluebonnet Ln
- 3409 Murphy Dr
- 2805 Bluebonnet Ln
- 2816 Bluebonnet Ln
- 2817 Cummings Dr
- 2812 Cummings Dr