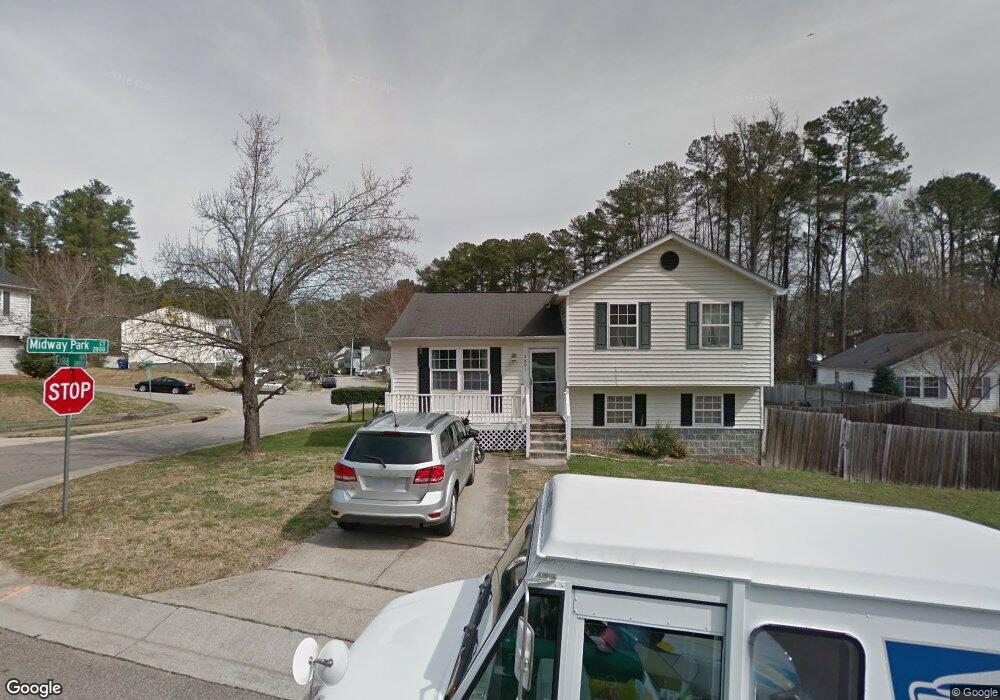
2801 Enka Dr Raleigh, NC 27610
South Raleigh NeighborhoodEstimated Value: $246,000 - $292,530
3
Beds
3
Baths
1,548
Sq Ft
$172/Sq Ft
Est. Value
About This Home
This home is located at 2801 Enka Dr, Raleigh, NC 27610 and is currently estimated at $266,883, approximately $172 per square foot. 2801 Enka Dr is a home located in Wake County with nearby schools including Walnut Creek Elementary School, Carnage Magnet Middle School, and Southeast Raleigh Magnet High School.
Ownership History
Date
Name
Owned For
Owner Type
Purchase Details
Closed on
Jan 28, 2015
Sold by
Evans Travis M
Bought by
Wilson Sylvia M and Wilson Anthony
Current Estimated Value
Home Financials for this Owner
Home Financials are based on the most recent Mortgage that was taken out on this home.
Original Mortgage
$110,000
Outstanding Balance
$84,808
Interest Rate
3.94%
Mortgage Type
New Conventional
Estimated Equity
$182,075
Purchase Details
Closed on
Nov 6, 2014
Sold by
Evans Alisha S
Bought by
Evans Travis M
Purchase Details
Closed on
Nov 26, 2007
Sold by
First Tennessee Bank Na
Bought by
Evans Travis M and Evans Alisha S
Home Financials for this Owner
Home Financials are based on the most recent Mortgage that was taken out on this home.
Original Mortgage
$110,888
Interest Rate
6.36%
Mortgage Type
FHA
Purchase Details
Closed on
Mar 23, 2007
Sold by
Williams Melvin L and Williams Deborah J
Bought by
First Tennessee Bank Na
Create a Home Valuation Report for This Property
The Home Valuation Report is an in-depth analysis detailing your home's value as well as a comparison with similar homes in the area
Home Values in the Area
Average Home Value in this Area
Purchase History
| Date | Buyer | Sale Price | Title Company |
|---|---|---|---|
| Wilson Sylvia M | $110,000 | None Available | |
| Evans Travis M | -- | None Available | |
| Evans Travis M | $112,000 | None Available | |
| First Tennessee Bank Na | $94,786 | None Available |
Source: Public Records
Mortgage History
| Date | Status | Borrower | Loan Amount |
|---|---|---|---|
| Open | Wilson Sylvia M | $110,000 | |
| Previous Owner | Evans Travis M | $110,888 |
Source: Public Records
Tax History Compared to Growth
Tax History
| Year | Tax Paid | Tax Assessment Tax Assessment Total Assessment is a certain percentage of the fair market value that is determined by local assessors to be the total taxable value of land and additions on the property. | Land | Improvement |
|---|---|---|---|---|
| 2025 | $2,392 | $272,026 | $110,000 | $162,026 |
| 2024 | $2,383 | $272,026 | $110,000 | $162,026 |
| 2023 | $1,714 | $155,424 | $36,000 | $119,424 |
| 2022 | $1,594 | $155,424 | $36,000 | $119,424 |
| 2021 | $1,532 | $155,424 | $36,000 | $119,424 |
| 2020 | $1,505 | $155,424 | $36,000 | $119,424 |
| 2019 | $1,345 | $114,333 | $26,000 | $88,333 |
| 2018 | $1,269 | $114,333 | $26,000 | $88,333 |
| 2017 | $1,209 | $114,333 | $26,000 | $88,333 |
| 2016 | $1,185 | $114,333 | $26,000 | $88,333 |
| 2015 | $1,276 | $121,305 | $32,000 | $89,305 |
| 2014 | -- | $121,305 | $32,000 | $89,305 |
Source: Public Records
Map
Nearby Homes
- 1725 Fox Hollow Dr
- 1416 Oakhill Ct
- 2200 Sanderford Rd
- 2908 Basswood Dr
- 2801 Quince Dr
- 3221 Snowberry Dr
- 1200 Armstrong Cir
- 3204 Winfield Ct
- 3405 Mogollon Ct
- 3305 Paschall Ct
- 1200 Hazelnut Dr
- 3208 Tradewind Ct
- 2816 Smoke Place
- 1445 Lombar St
- 3620 Waleback Ln
- 3140 Slippery Elm Dr
- 1316 Foxrun Dr
- 2809 Newark Dr
- 2400 Keith Dr
- 2509 Australia Dr
- 2801 Midway Park Ct
- 2805 Enka Dr
- 2809 Enka Dr
- 2800 Enka Dr
- 2737 Midway Park Ct
- 2800 Midway Park Ct
- 2808 Midway Park Ct
- 2813 Enka Dr
- 2812 Enka Dr
- 2813 Midway Park Ct
- 2812 Midway Park Ct
- 2600 Big Oak St
- 2808 Enka Dr
- 2804 Enka Dr
- 2732 Midway Park Ct
- 2601 Big Oak St
- 2816 Midway Park Ct
- 2817 Midway Park Ct
- 2604 Big Oak St
- 2729 Midway Park Ct