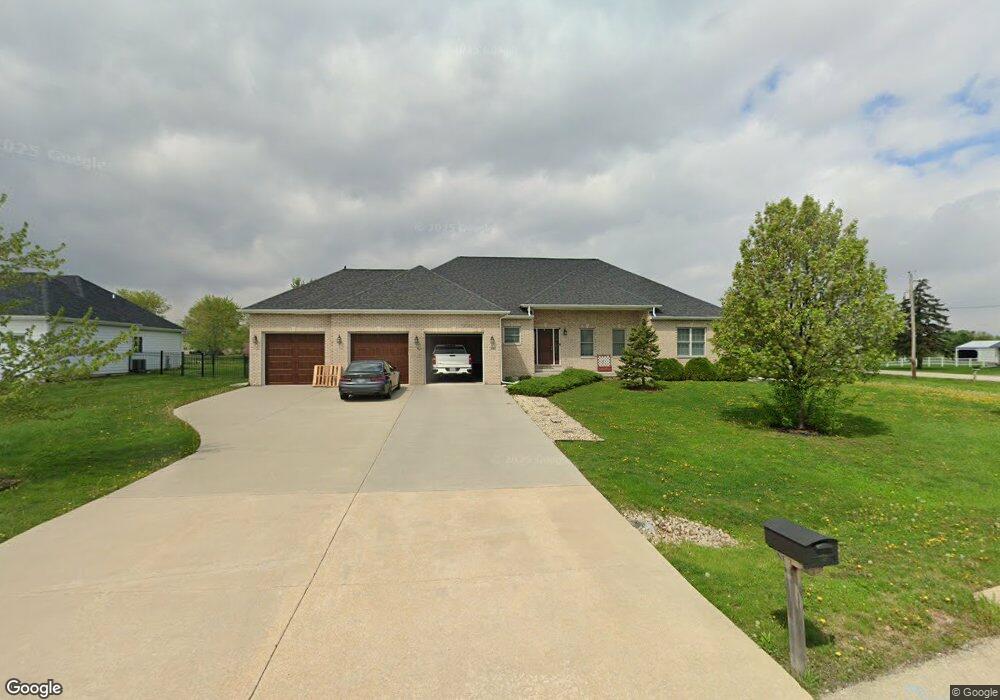
2801 Ninovan Ln Minooka, IL 60447
Estimated Value: $583,000 - $636,000
Studio
--
Bath
2,320
Sq Ft
$262/Sq Ft
Est. Value
About This Home
This home is located at 2801 Ninovan Ln, Minooka, IL 60447 and is currently estimated at $606,946, approximately $261 per square foot. 2801 Ninovan Ln is a home located in Grundy County with nearby schools including Minooka Primary Center, Minooka Elementary School, and Minooka Junior High School.
Ownership History
Date
Name
Owned For
Owner Type
Purchase Details
Closed on
May 16, 2017
Sold by
Edward J Guidi
Bought by
Davenport Chad and Davenport Caitlin
Current Estimated Value
Home Financials for this Owner
Home Financials are based on the most recent Mortgage that was taken out on this home.
Original Mortgage
$251,200
Outstanding Balance
$208,617
Interest Rate
4.05%
Estimated Equity
$398,329
Create a Home Valuation Report for This Property
The Home Valuation Report is an in-depth analysis detailing your home's value as well as a comparison with similar homes in the area
Purchase History
| Date | Buyer | Sale Price | Title Company |
|---|---|---|---|
| Davenport Chad | $314,000 | -- |
Source: Public Records
Mortgage History
| Date | Status | Borrower | Loan Amount |
|---|---|---|---|
| Open | Davenport Chad | $251,200 | |
| Closed | Davenport Chad | -- |
Source: Public Records
Tax History
| Year | Tax Paid | Tax Assessment Tax Assessment Total Assessment is a certain percentage of the fair market value that is determined by local assessors to be the total taxable value of land and additions on the property. | Land | Improvement |
|---|---|---|---|---|
| 2024 | $13,389 | $166,925 | $21,849 | $145,076 |
| 2023 | $12,204 | $152,151 | $19,915 | $132,236 |
| 2022 | $10,866 | $141,470 | $18,517 | $122,953 |
| 2021 | $10,231 | $133,917 | $17,528 | $116,389 |
| 2020 | $9,983 | $128,104 | $16,767 | $111,337 |
| 2019 | $10,247 | $128,133 | $15,525 | $112,608 |
| 2018 | $9,659 | $118,531 | $15,351 | $103,180 |
| 2017 | $9,383 | $110,871 | $14,659 | $96,212 |
| 2016 | $8,782 | $104,074 | $22,070 | $82,004 |
| 2015 | $4,134 | $94,604 | $20,062 | $74,542 |
| 2014 | $784 | $18,955 | $18,955 | $0 |
| 2013 | $804 | $19,210 | $19,210 | $0 |
Source: Public Records
Map
Nearby Homes
- 2812 Ninovan Ln
- 2813 Ninovan Ln
- 2823 Ninovan Ln
- 2811 Ninovan Ln
- 23 Birch Ave
- 12 Maple St
- 35 Cedar St
- 6010-6060 E Minooka Rd
- 2037 Isabella Ln
- 5455 Sand Ridge Rd
- 714 Joanne Dr
- LOT 28 O Toole Dr
- 706 O Toole Dr
- Lot 1 Minooka Ridge & Jones Rd
- 2041 Isabella Ln
- 805 Edgewater Dr
- 1315 Burns Ln
- 1403 Fabiola Ct S
- 1380 Dahlgren Ln
- 1101 Burns Ln
- 2803 Ninovan Ln
- 5225 E Minooka Rd
- 2805 Ninovan Ln
- 2806 Ninovan Ln
- 2802 Ninovan Ln
- 2808 Ninovan Ln
- 5240 E Minooka Rd
- 2810 Ninovan Ln
- 2809 Ninovan Ln
- 5175 E Minooka Rd
- 5200 E Minooka Rd
- 2814 Ninovan Ln
- 2816 Ninovan Ln
- 2815 Ninovan Ln
- 5160 E Minooka Rd
- 5140 E Minooka Rd
- 204 Barefoot Ct
- 2819 Ninovan Ln
- 5130 E Minooka Rd
- 206 Barefoot Ct
Your Personal Tour Guide
Ask me questions while you tour the home.