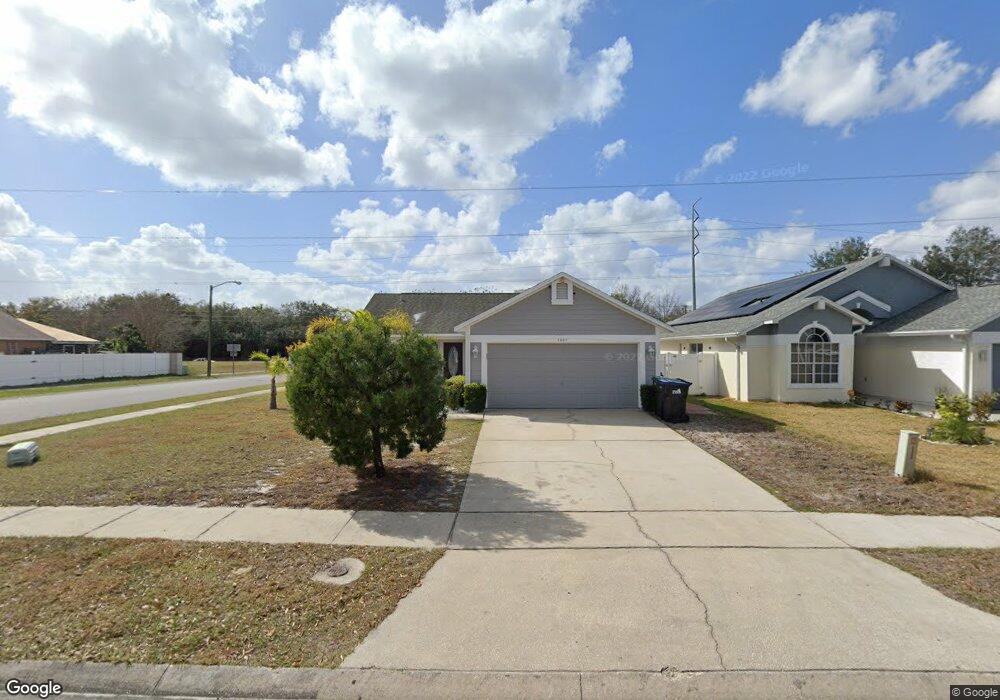
2802 Delcrest Ct Orlando, FL 32817
Estimated Value: $311,000 - $349,000
2
Beds
2
Baths
1,052
Sq Ft
$307/Sq Ft
Est. Value
About This Home
This home is located at 2802 Delcrest Ct, Orlando, FL 32817 and is currently estimated at $322,909, approximately $306 per square foot. 2802 Delcrest Ct is a home located in Orange County with nearby schools including Arbor Ridge School, Glenridge Middle, and Winter Park High.
Ownership History
Date
Name
Owned For
Owner Type
Purchase Details
Closed on
Jul 7, 2018
Sold by
Krzeminski Jacek Wojciech
Bought by
Krzeminska Agnieszka Malgorzata
Current Estimated Value
Purchase Details
Closed on
May 8, 2008
Sold by
Pavlovsky Christopher M and Pavlovsky Michelle
Bought by
Krzeminski Jacek and Krzeminski Agnieszka M
Home Financials for this Owner
Home Financials are based on the most recent Mortgage that was taken out on this home.
Original Mortgage
$149,159
Interest Rate
5.97%
Mortgage Type
FHA
Purchase Details
Closed on
Nov 29, 1999
Sold by
Perez Samuel E and Perez Nancy
Bought by
Pavlovsky Christophe M and Pavlovsky Michelle
Home Financials for this Owner
Home Financials are based on the most recent Mortgage that was taken out on this home.
Original Mortgage
$74,949
Interest Rate
7.89%
Mortgage Type
FHA
Create a Home Valuation Report for This Property
The Home Valuation Report is an in-depth analysis detailing your home's value as well as a comparison with similar homes in the area
Home Values in the Area
Average Home Value in this Area
Purchase History
| Date | Buyer | Sale Price | Title Company |
|---|---|---|---|
| Krzeminska Agnieszka Malgorzata | $44,000 | Attorney | |
| Krzeminski Jacek | $151,500 | Multiple | |
| Pavlovsky Christophe M | $75,000 | -- |
Source: Public Records
Mortgage History
| Date | Status | Borrower | Loan Amount |
|---|---|---|---|
| Previous Owner | Krzeminski Jacek | $149,159 | |
| Previous Owner | Pavlovsky Christophe M | $108,000 | |
| Previous Owner | Pavlovsky Christophe M | $74,949 |
Source: Public Records
Tax History Compared to Growth
Tax History
| Year | Tax Paid | Tax Assessment Tax Assessment Total Assessment is a certain percentage of the fair market value that is determined by local assessors to be the total taxable value of land and additions on the property. | Land | Improvement |
|---|---|---|---|---|
| 2025 | $1,577 | $114,022 | -- | -- |
| 2024 | $1,471 | $114,022 | -- | -- |
| 2023 | $1,471 | $107,582 | $0 | $0 |
| 2022 | $1,388 | $104,449 | $0 | $0 |
| 2021 | $1,353 | $101,407 | $0 | $0 |
| 2020 | $1,282 | $100,007 | $0 | $0 |
| 2019 | $1,304 | $97,759 | $0 | $0 |
| 2018 | $1,281 | $95,936 | $0 | $0 |
| 2017 | $1,245 | $132,183 | $36,750 | $95,433 |
| 2016 | $1,216 | $119,567 | $35,000 | $84,567 |
| 2015 | $1,232 | $110,145 | $30,000 | $80,145 |
| 2014 | $1,265 | $112,505 | $30,000 | $82,505 |
Source: Public Records
Map
Nearby Homes
- 9205 Telfer Run
- 9355 Telfer Run
- 3544 N Econlockhatchee Trail
- 9650 Lake Douglas Place
- 2736 Logandale Dr
- 3230 Lakewood Pointe Dr
- 9325 Echo Run
- 9049 Fryland Rd
- 9551 Lake Douglas Place
- 3713 N Econlockhatchee Trail
- 2509 Poet Ln
- 2503 Poet Ln
- 8622 Baylor Cir
- 9314 Trevarthon Rd
- 2831 Smu Blvd
- 9316 Trevarthon Rd
- 9312 Trevarthon Rd
- 9318 Trevarthon Rd
- 3721 Daventry Rd
- 2859 Tcu Blvd
- 2812 Delcrest Dr
- 2810 Delcrest Ct
- 2601 Delcrest Dr
- 2811 Delcrest Ct
- 2803 Delcrest Ct
- 2814 Delcrest Ct
- 2605 Delcrest Dr
- 2824 Delcrest Dr
- 2807 Delcrest Ct
- 2602 Delcrest Dr
- 2818 Delcrest Ct Unit 2
- 2818 Delcrest Ct
- 2609 Delcrest Dr
- 2815 Delcrest Ct
- 2606 Delcrest Dr
- 2822 Delcrest Ct
- 2819 Delcrest Ct
- 2804 Delcrest Dr
- 2613 Delcrest Dr
- 2808 Delcrest Dr