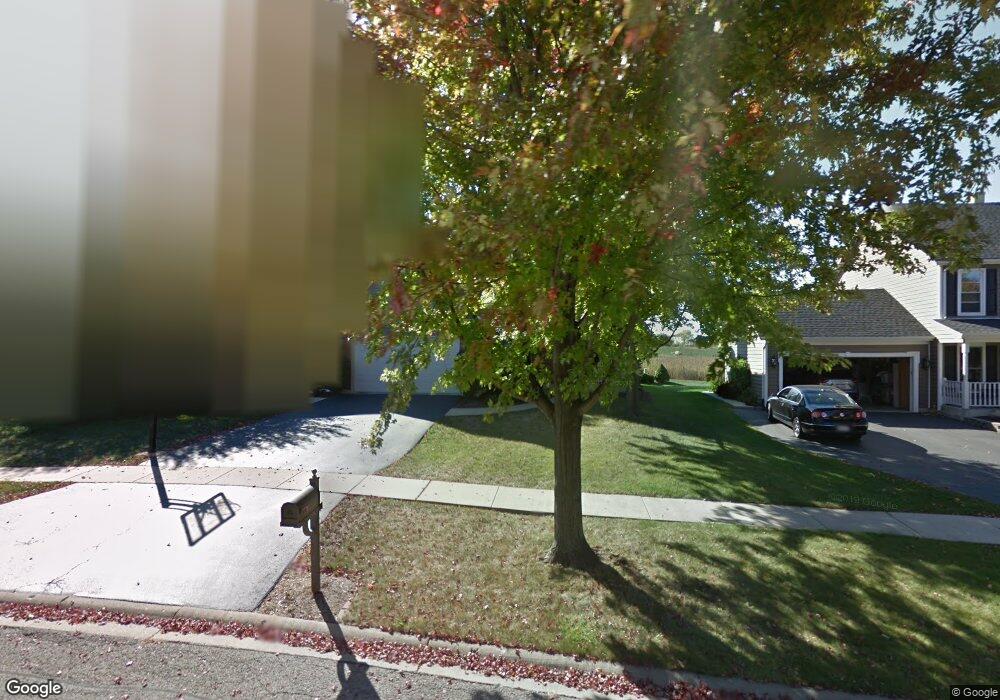
2802 Miller Rd Geneva, IL 60134
Southwest Geneva NeighborhoodEstimated Value: $489,025 - $510,000
4
Beds
3
Baths
1,934
Sq Ft
$259/Sq Ft
Est. Value
About This Home
This home is located at 2802 Miller Rd, Geneva, IL 60134 and is currently estimated at $500,256, approximately $258 per square foot. 2802 Miller Rd is a home located in Kane County with nearby schools including Williamsburg Elementary School, Geneva Community High School, and St. Peter School.
Ownership History
Date
Name
Owned For
Owner Type
Purchase Details
Closed on
Jun 22, 2016
Sold by
Conforti David and Degrado Conforti Jane
Bought by
Conforti David and Degrado Conforti Jane
Current Estimated Value
Purchase Details
Closed on
Jun 19, 2006
Sold by
Shannon Daniel H and Shannon Beth M
Bought by
Conforti David J and Degrado Conforti Jane M
Home Financials for this Owner
Home Financials are based on the most recent Mortgage that was taken out on this home.
Original Mortgage
$249,000
Interest Rate
6.72%
Mortgage Type
Purchase Money Mortgage
Purchase Details
Closed on
Apr 19, 1996
Sold by
Keim Corp
Bought by
Shannon Daniel H and Shannon Beth M
Home Financials for this Owner
Home Financials are based on the most recent Mortgage that was taken out on this home.
Original Mortgage
$172,790
Interest Rate
7.86%
Mortgage Type
Balloon
Purchase Details
Closed on
Dec 9, 1994
Sold by
Nbd Bank
Bought by
Keim Corp
Create a Home Valuation Report for This Property
The Home Valuation Report is an in-depth analysis detailing your home's value as well as a comparison with similar homes in the area
Home Values in the Area
Average Home Value in this Area
Purchase History
| Date | Buyer | Sale Price | Title Company |
|---|---|---|---|
| Conforti David | -- | None Available | |
| Conforti David J | $349,000 | Chicago Title Insurance Co | |
| Shannon Daniel H | $215,000 | Chicago Title Insurance Co | |
| Keim Corp | $178,000 | Chicago Title Insurance Co |
Source: Public Records
Mortgage History
| Date | Status | Borrower | Loan Amount |
|---|---|---|---|
| Previous Owner | Conforti David J | $249,000 | |
| Previous Owner | Shannon Daniel H | $172,790 |
Source: Public Records
Tax History
| Year | Tax Paid | Tax Assessment Tax Assessment Total Assessment is a certain percentage of the fair market value that is determined by local assessors to be the total taxable value of land and additions on the property. | Land | Improvement |
|---|---|---|---|---|
| 2024 | $9,656 | $133,921 | $39,949 | $93,972 |
| 2023 | $9,404 | $121,746 | $36,317 | $85,429 |
| 2022 | $9,015 | $113,126 | $33,746 | $79,380 |
| 2021 | $8,748 | $108,922 | $32,492 | $76,430 |
| 2020 | $8,644 | $107,259 | $31,996 | $75,263 |
| 2019 | $8,620 | $105,228 | $31,390 | $73,838 |
| 2018 | $8,156 | $99,968 | $31,390 | $68,578 |
| 2017 | $8,063 | $97,302 | $30,553 | $66,749 |
| 2016 | $8,101 | $95,987 | $30,140 | $65,847 |
| 2015 | -- | $91,260 | $28,656 | $62,604 |
| 2014 | -- | $95,256 | $28,656 | $66,600 |
| 2013 | -- | $95,256 | $28,656 | $66,600 |
Source: Public Records
Map
Nearby Homes
- 2782 Miller Rd
- 723 Branson Dr
- 449 Freedlund Course
- Unit 8A Prairie Grove Dr
- Unit 6A Prairie Grove Dr
- Unit 4B Prairie Grove Dr
- Unit 5B Prairie Grove Dr
- Unit 8B Prairie Grove Dr
- Unit 4A Prairie Grove Dr
- Unit 5A Prairie Grove Dr
- Unit 7A Prairie Grove Dr
- Unit 6C Prairie Grove Dr
- Unit 5C Prairie Grove Dr
- Unit 6B Prairie Grove Dr
- Unit 4C Prairie Grove Dr
- Unit 7C Prairie Grove Dr
- 433 Freedlund Course
- 417 Freedlund Course
- 839 S Randall Rd
- 348 Branson Dr
- 2798 Miller Rd
- 2806 Miller Rd
- 2810 Miller Rd
- 2794 Miller Rd
- 2801 Miller Rd
- 2811 Miller Rd
- 2814 Miller Rd
- 2790 Miller Rd
- 2781 Miller Rd
- 2786 Miller Rd
- 2817 Miller Rd
- 2777 Miller Rd
- 2821 Miller Rd
- 2778 Miller Rd
- 2825 Miller Rd
- 2834 Miller Rd
- 2773 Miller Rd
- 2774 Miller Rd
- 2829 Miller Rd
- 2660 Berkshire Dr Unit 9
Your Personal Tour Guide
Ask me questions while you tour the home.