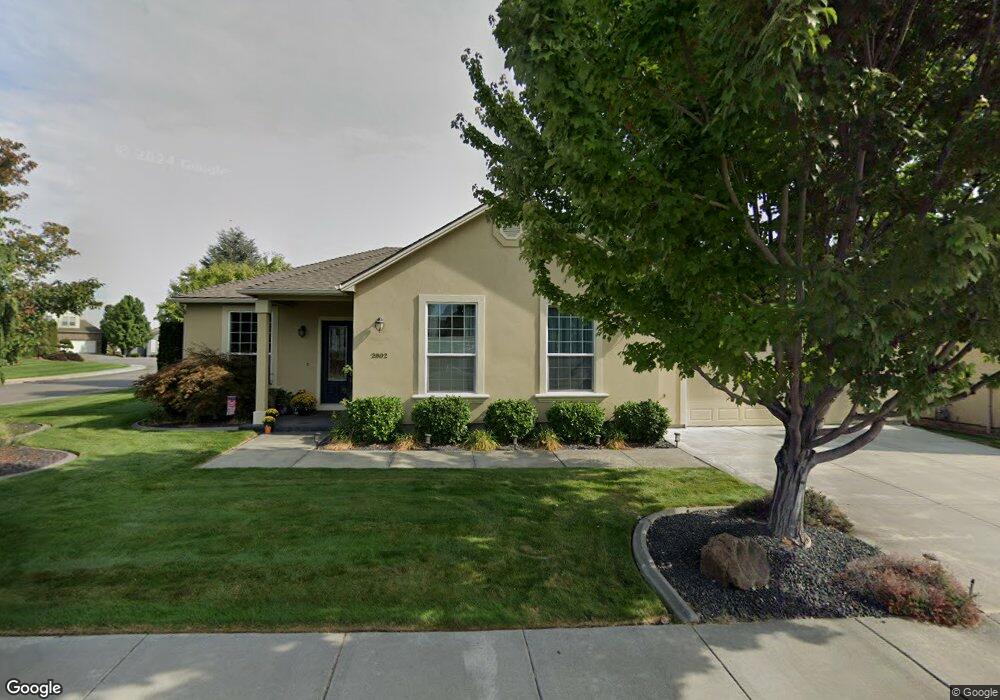
2802 Sawgrass Loop Richland, WA 99354
Estimated Value: $485,000 - $570,000
4
Beds
2
Baths
2,228
Sq Ft
$237/Sq Ft
Est. Value
About This Home
This home is located at 2802 Sawgrass Loop, Richland, WA 99354 and is currently estimated at $529,063, approximately $237 per square foot. 2802 Sawgrass Loop is a home located in Benton County with nearby schools including Sacajawea Elementary School, Chief Joseph Middle School, and Hanford High School.
Ownership History
Date
Name
Owned For
Owner Type
Purchase Details
Closed on
Jul 2, 2007
Sold by
Js Frasier Inc
Bought by
Thesenvitz Glenn and Thesenvitz Sharleen
Current Estimated Value
Home Financials for this Owner
Home Financials are based on the most recent Mortgage that was taken out on this home.
Original Mortgage
$100,000
Outstanding Balance
$60,559
Interest Rate
6.36%
Mortgage Type
Purchase Money Mortgage
Estimated Equity
$468,504
Purchase Details
Closed on
Oct 27, 2006
Sold by
Lottis Mark C and Lottis Karen A
Bought by
Js Frasier Inc
Home Financials for this Owner
Home Financials are based on the most recent Mortgage that was taken out on this home.
Original Mortgage
$226,000
Interest Rate
6.36%
Mortgage Type
Construction
Purchase Details
Closed on
Aug 24, 2006
Sold by
Lottis Mark C and Lottis Karen A
Bought by
Js Frasier Inc
Purchase Details
Closed on
Apr 25, 2006
Sold by
North Stone Richland Llc
Bought by
Lottis Mark C and Lottis Karen A
Purchase Details
Closed on
Jan 27, 2006
Sold by
North Stone Richland Llc
Bought by
Lottis Mark C and Lottis Karen A
Create a Home Valuation Report for This Property
The Home Valuation Report is an in-depth analysis detailing your home's value as well as a comparison with similar homes in the area
Home Values in the Area
Average Home Value in this Area
Purchase History
| Date | Buyer | Sale Price | Title Company |
|---|---|---|---|
| Thesenvitz Glenn | $260,000 | Frontier Title & Esc | |
| Js Frasier Inc | $40,000 | Frontier Title & Esc | |
| Js Frasier Inc | $45,000 | Frontier Title & Esc | |
| Lottis Mark C | -- | Frontier Title & Esc | |
| Lottis Mark C | $340,000 | Frontier Title & Esc |
Source: Public Records
Mortgage History
| Date | Status | Borrower | Loan Amount |
|---|---|---|---|
| Open | Thesenvitz Glenn | $100,000 | |
| Previous Owner | Js Frasier Inc | $226,000 |
Source: Public Records
Tax History
| Year | Tax Paid | Tax Assessment Tax Assessment Total Assessment is a certain percentage of the fair market value that is determined by local assessors to be the total taxable value of land and additions on the property. | Land | Improvement |
|---|---|---|---|---|
| 2025 | $4,764 | $463,500 | $80,000 | $383,500 |
| 2024 | $4,435 | $511,680 | $70,000 | $441,680 |
| 2023 | $4,435 | $473,820 | $70,000 | $403,820 |
| 2022 | $3,842 | $385,490 | $70,000 | $315,490 |
| 2021 | $3,710 | $347,630 | $70,000 | $277,630 |
| 2020 | $3,923 | $322,390 | $70,000 | $252,390 |
| 2019 | $3,104 | $322,390 | $70,000 | $252,390 |
| 2018 | $3,217 | $274,440 | $55,640 | $218,800 |
| 2017 | $2,835 | $237,970 | $55,640 | $182,330 |
| 2016 | $2,794 | $237,970 | $55,640 | $182,330 |
| 2015 | $2,847 | $237,970 | $55,640 | $182,330 |
| 2014 | -- | $237,970 | $55,640 | $182,330 |
| 2013 | -- | $237,970 | $55,640 | $182,330 |
Source: Public Records
Map
Nearby Homes
- 2843 Troon Ct
- 2815 Riverbend Dr
- 2940 Sedona Cir
- 2601 Eagle Watch Loop
- 2312 Coppercreek St
- 2624 Eagle Watch Loop
- 2628 Scottsdale Place
- 2924 Redrock Ridge Loop
- 2665 Maidstone St
- 2981 Redrock Ridge Loop
- 2713 Torrey Pines Way
- 3020 Redrock Ridge Loop
- 3294 Wild Canyon Way
- NKA Keene Rd
- 3359 Village Pkwy
- 2557 Logan St
- 3097 Bobwhite Way
- 3150 Quail Ridge Loop
- 3170 Mountain Quail Ln
- 3182 Mountain Quail Ln
- 2530 Tilden Ct
- 2807 Sawgrass Loop
- 2798 Sawgrass Loop
- 2548 Tilden Ct
- 2812 Sawgrass Loop
- 2816 Sawgrass Loop
- 2533 Tilden Ct
- 2801 Sawgrass Loop
- 2835 Sawgrass Loop
- 2824 Sawgrass Loop
- 2794 Sawgrass Loop
- 2574 Tilden Ct
- 2797 Sawgrass Loop
- 2830 Sawgrass Loop
- 2790 Sawgrass Loop
- 2836 Sawgrass Loop Unit Right on the 17th Ho
- 2836 Sawgrass Loop Unit Finished Shop Size G
- 2836 Sawgrass Loop Unit Golf Course Frontage
- 2836 Sawgrass Loop
- 2581 Tilden Ct
Your Personal Tour Guide
Ask me questions while you tour the home.