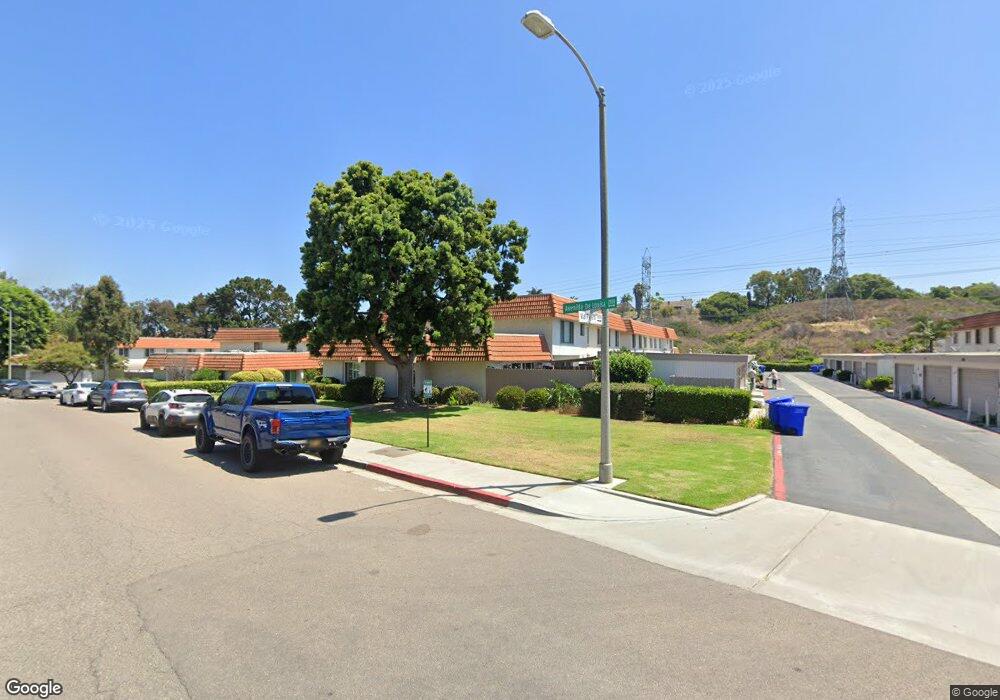
2802 Via Pajaro Carlsbad, CA 92010
Tamarack Point NeighborhoodEstimated Value: $623,829 - $794,000
2
Beds
2
Baths
912
Sq Ft
$781/Sq Ft
Est. Value
About This Home
This home is located at 2802 Via Pajaro, Carlsbad, CA 92010 and is currently estimated at $712,457, approximately $781 per square foot. 2802 Via Pajaro is a home located in San Diego County with nearby schools including Buena Vista Elementary, Carlsbad High School, and Sage Creek High.
Ownership History
Date
Name
Owned For
Owner Type
Purchase Details
Closed on
Apr 3, 2007
Sold by
Merchant Sharan E and Calzia Sharan E
Bought by
Merchant Sharan E
Current Estimated Value
Home Financials for this Owner
Home Financials are based on the most recent Mortgage that was taken out on this home.
Original Mortgage
$34,500
Outstanding Balance
$20,802
Interest Rate
6.1%
Mortgage Type
Stand Alone Second
Estimated Equity
$691,655
Purchase Details
Closed on
Oct 1, 1999
Sold by
Little Shane M and Little Amy K
Bought by
Calzia Sharan E
Home Financials for this Owner
Home Financials are based on the most recent Mortgage that was taken out on this home.
Original Mortgage
$132,050
Interest Rate
7.82%
Purchase Details
Closed on
Jan 25, 1990
Purchase Details
Closed on
Mar 30, 1989
Create a Home Valuation Report for This Property
The Home Valuation Report is an in-depth analysis detailing your home's value as well as a comparison with similar homes in the area
Home Values in the Area
Average Home Value in this Area
Purchase History
| Date | Buyer | Sale Price | Title Company |
|---|---|---|---|
| Merchant Sharan E | -- | Old Republic Title Company | |
| Calzia Sharan E | $139,000 | Commonwealth Land Title Co | |
| Calzia Sharan E | -- | Commonwealth Land Title Co | |
| -- | $133,900 | -- | |
| -- | $110,000 | -- |
Source: Public Records
Mortgage History
| Date | Status | Borrower | Loan Amount |
|---|---|---|---|
| Open | Merchant Sharan E | $34,500 | |
| Open | Merchant Sharan E | $276,000 | |
| Previous Owner | Calzia Sharan E | $132,050 |
Source: Public Records
Tax History Compared to Growth
Tax History
| Year | Tax Paid | Tax Assessment Tax Assessment Total Assessment is a certain percentage of the fair market value that is determined by local assessors to be the total taxable value of land and additions on the property. | Land | Improvement |
|---|---|---|---|---|
| 2025 | $2,201 | $213,612 | $55,719 | $157,893 |
| 2024 | $2,201 | $209,425 | $54,627 | $154,798 |
| 2023 | $2,187 | $205,319 | $53,556 | $151,763 |
| 2022 | $2,152 | $201,294 | $52,506 | $148,788 |
| 2021 | $2,134 | $197,348 | $51,477 | $145,871 |
| 2020 | $2,120 | $195,326 | $50,950 | $144,376 |
| 2019 | $2,080 | $191,497 | $49,951 | $141,546 |
| 2018 | $1,992 | $187,743 | $48,972 | $138,771 |
| 2017 | $1,957 | $184,062 | $48,012 | $136,050 |
| 2016 | $1,877 | $180,454 | $47,071 | $133,383 |
| 2015 | $1,869 | $177,744 | $46,364 | $131,380 |
| 2014 | $1,837 | $174,263 | $45,456 | $128,807 |
Source: Public Records
Map
Nearby Homes
- 2517 Via Astuto Unit 1
- 2334 Kimberly Ct
- 3442 Celinda Dr
- 2360 Hosp Way Unit 331
- 2360 Paseo de Laura Unit 2
- 2336 Hosp Way Unit 314
- 3354 Seacrest Dr
- 3190 Falcon Dr
- 3365 Seacrest Dr
- 2195 Basswood Ave
- 3072 Marron Rd
- 3306 Donna Dr
- 3304 Telaga Rd
- 2225 David Place
- 2035 Basswood Ave
- 3573 Paseo de Los Californianos Unit 273
- 3520 Paseo De Los Americanos Unit 102
- 2732 Forest Park Ln
- 2062 Avenue of The Trees
- 2755 Victoria Ave
- 2804 Via Pajaro
- 2806 Via Pajaro
- 2808 Via Pajaro
- 2810 Via Pajaro Unit 1
- 2805 Via Pajaro
- 2803 Via Pajaro
- 2801 Via Pajaro
- 2807 Via Pajaro
- 2801 Via Magia
- 2809 Via Pajaro
- 2812 Via Pajaro Unit 1
- 2803 Via Magia
- 2805 Via Magia
- 2811 Via Pajaro
- 3018 Via Denise
- 3016 Via Denise
- 2814 Via Pajaro Unit 1
- 2807 Via Magia
- 3014 Via Denise Unit 1
- 3020 Via Denise Unit 1