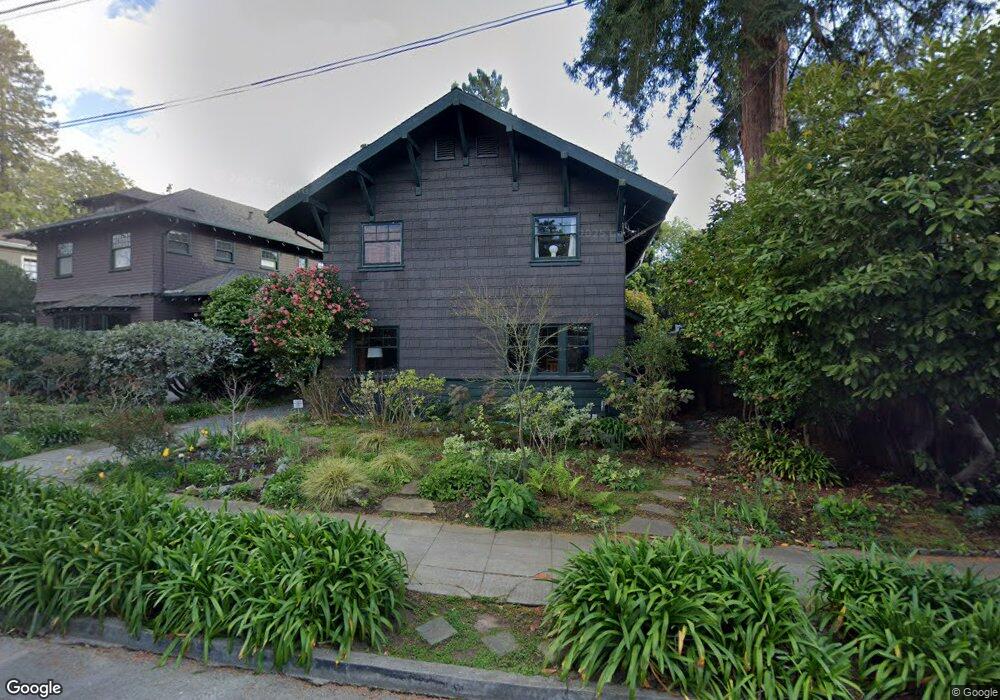
2802 Woolsey St Berkeley, CA 94705
Elmwood NeighborhoodEstimated Value: $2,239,097 - $2,577,000
3
Beds
2
Baths
2,022
Sq Ft
$1,223/Sq Ft
Est. Value
About This Home
This home is located at 2802 Woolsey St, Berkeley, CA 94705 and is currently estimated at $2,472,774, approximately $1,222 per square foot. 2802 Woolsey St is a home located in Alameda County with nearby schools including John Muir Elementary School, Emerson Elementary School, and Malcolm X Elementary School.
Ownership History
Date
Name
Owned For
Owner Type
Purchase Details
Closed on
Jul 23, 2021
Sold by
Mayer Steven L and Milden Mayer 2013 Trust
Bought by
Mayer Steven L and Steven L Mayer Survivors Trust
Current Estimated Value
Purchase Details
Closed on
Apr 30, 2015
Sold by
Mayer Steven L and Milden Randy S
Bought by
Milden Mayer 2013 Trust
Purchase Details
Closed on
May 2, 2007
Sold by
Salgado Isabelle and Esler Eric A
Bought by
Mayer Steven L and Milden Randy S
Home Financials for this Owner
Home Financials are based on the most recent Mortgage that was taken out on this home.
Original Mortgage
$650,000
Interest Rate
5.83%
Mortgage Type
Purchase Money Mortgage
Purchase Details
Closed on
Sep 7, 1994
Sold by
Wiegand Della and Helen S Wood Trust
Bought by
Esler Eric A and Salgado Isabelle
Home Financials for this Owner
Home Financials are based on the most recent Mortgage that was taken out on this home.
Original Mortgage
$363,000
Interest Rate
4.25%
Create a Home Valuation Report for This Property
The Home Valuation Report is an in-depth analysis detailing your home's value as well as a comparison with similar homes in the area
Home Values in the Area
Average Home Value in this Area
Purchase History
| Date | Buyer | Sale Price | Title Company |
|---|---|---|---|
| Mayer Steven L | -- | None Available | |
| Milden Mayer 2013 Trust | -- | None Available | |
| Mayer Steven L | $1,493,500 | Placer Title Company | |
| Esler Eric A | $403,500 | Fidelity National Title Ins |
Source: Public Records
Mortgage History
| Date | Status | Borrower | Loan Amount |
|---|---|---|---|
| Closed | Mayer Steven L | $650,000 | |
| Previous Owner | Esler Eric A | $363,000 |
Source: Public Records
Tax History
| Year | Tax Paid | Tax Assessment Tax Assessment Total Assessment is a certain percentage of the fair market value that is determined by local assessors to be the total taxable value of land and additions on the property. | Land | Improvement |
|---|---|---|---|---|
| 2025 | $27,556 | $1,993,811 | $600,243 | $1,400,568 |
| 2024 | $27,556 | $1,954,591 | $588,477 | $1,373,114 |
| 2023 | $27,019 | $1,923,134 | $576,940 | $1,346,194 |
| 2022 | $26,608 | $1,878,438 | $565,631 | $1,319,807 |
| 2021 | $26,722 | $1,841,474 | $554,542 | $1,293,932 |
| 2020 | $25,443 | $1,829,521 | $548,856 | $1,280,665 |
| 2019 | $24,617 | $1,793,663 | $538,099 | $1,255,564 |
| 2018 | $24,249 | $1,758,505 | $527,551 | $1,230,954 |
| 2017 | $23,450 | $1,724,035 | $517,210 | $1,206,825 |
| 2016 | $22,828 | $1,690,238 | $507,071 | $1,183,167 |
| 2015 | $22,544 | $1,664,863 | $499,459 | $1,165,404 |
| 2014 | -- | $1,632,260 | $489,678 | $1,142,582 |
Source: Public Records
Map
Nearby Homes
- 2800 Prince St
- 2962 Piedmont Ave
- 2477 Prince St
- 360 Alcatraz Ave
- 6446 Colby St
- 6100 Chabot Rd
- 2935 Florence St
- 2817 Palm Ct
- 2643 Stuart St
- 5910 Chabot Rd
- 2917 Telegraph Ave
- 204 El Camino Real
- 6189 Margarido Dr
- 5936 Broadway
- 2243 Ashby Ave
- 3046 Deakin St
- 2632 Warring St Unit 2
- 2614 Warring St Unit 6A
- 1488 Alvarado Rd
- 190 Stonewall Rd
- 2804 Woolsey St
- 2800 Woolsey St
- 2808 Woolsey St
- 3111 Eton Ave Unit 4
- 3111 Eton Ave Unit 3
- 3111 Eton Ave Unit 2
- 3111 Eton Ave Unit 1
- 3115 Eton Ave Unit A
- 3115 Eton Ave Unit B
- 2810 Woolsey St
- 154 Brookside Dr
- 2741 Woolsey St
- 2743 Woolsey St
- 2737 Woolsey St
- 2814 Woolsey St
- 3119 Eton Ave
- 2747 Woolsey St
- 3107 Lewiston Ave
- 152 Brookside Dr
- 3109 Lewiston Ave
Your Personal Tour Guide
Ask me questions while you tour the home.