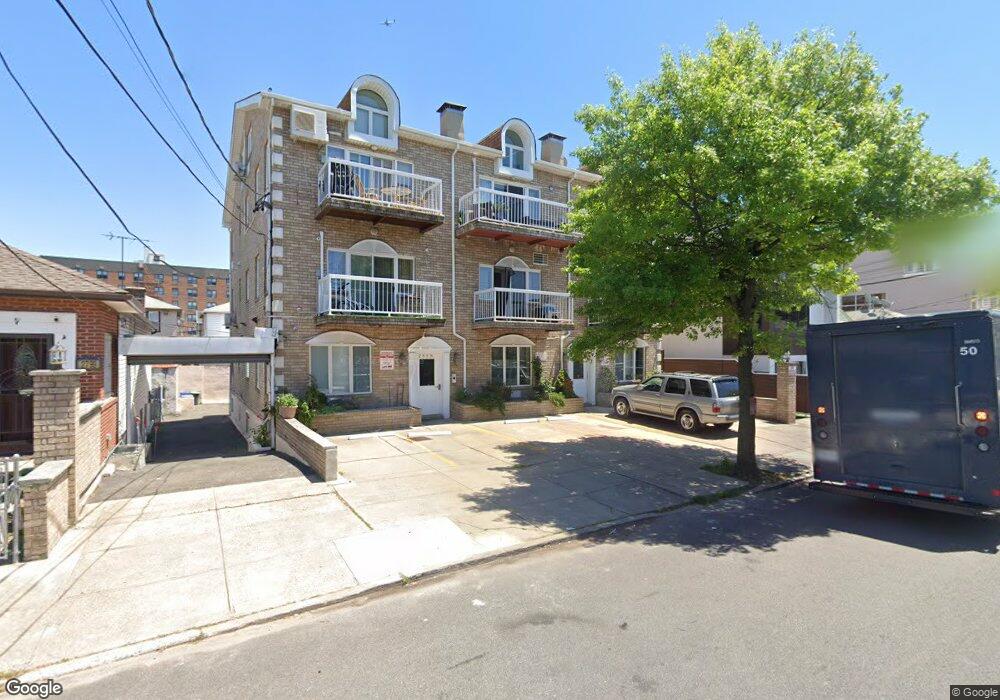
2803 Batchelder St Unit 1B Brooklyn, NY 11235
Sheepshead Bay NeighborhoodEstimated Value: $556,000 - $1,063,000
--
Bed
--
Bath
1,803
Sq Ft
$453/Sq Ft
Est. Value
About This Home
This home is located at 2803 Batchelder St Unit 1B, Brooklyn, NY 11235 and is currently estimated at $816,165, approximately $452 per square foot. 2803 Batchelder St Unit 1B is a home located in Kings County with nearby schools including P.S. 52 Sheepshead Bay, Jhs 14 Shell Bank, and New Visions Charter High School for Advanced Math/ Science.
Ownership History
Date
Name
Owned For
Owner Type
Purchase Details
Closed on
Dec 12, 2007
Sold by
Rozenfeld Karina and Rozenfeld Leonid
Bought by
Khait Yevgeniy and Shapovalova Tatyana
Current Estimated Value
Home Financials for this Owner
Home Financials are based on the most recent Mortgage that was taken out on this home.
Original Mortgage
$43,200
Outstanding Balance
$27,301
Interest Rate
6.27%
Estimated Equity
$788,864
Purchase Details
Closed on
Apr 2, 2002
Sold by
Batchelder Street Condom
Bought by
Rozenfeld Leonid and Rozenfeld Karina
Home Financials for this Owner
Home Financials are based on the most recent Mortgage that was taken out on this home.
Original Mortgage
$248,000
Interest Rate
6.92%
Mortgage Type
Purchase Money Mortgage
Create a Home Valuation Report for This Property
The Home Valuation Report is an in-depth analysis detailing your home's value as well as a comparison with similar homes in the area
Home Values in the Area
Average Home Value in this Area
Purchase History
| Date | Buyer | Sale Price | Title Company |
|---|---|---|---|
| Khait Yevgeniy | $433,000 | -- | |
| Khait Yevgeniy | $433,000 | -- | |
| Rozenfeld Leonid | -- | -- | |
| Rozenfeld Leonid | -- | -- |
Source: Public Records
Mortgage History
| Date | Status | Borrower | Loan Amount |
|---|---|---|---|
| Open | Khait Yevgeniy | $43,200 | |
| Closed | Khait Yevgeniy | $43,200 | |
| Open | Khait Yevgeniy | $346,400 | |
| Closed | Khait Yevgeniy | $346,400 | |
| Previous Owner | Rozenfeld Leonid | $31,000 | |
| Previous Owner | Rozenfeld Leonid | $248,000 |
Source: Public Records
Tax History Compared to Growth
Tax History
| Year | Tax Paid | Tax Assessment Tax Assessment Total Assessment is a certain percentage of the fair market value that is determined by local assessors to be the total taxable value of land and additions on the property. | Land | Improvement |
|---|---|---|---|---|
| 2025 | $10,138 | $100,108 | $13,950 | $86,158 |
| 2024 | $10,138 | $83,408 | $13,950 | $69,458 |
| 2023 | $7,967 | $81,042 | $13,950 | $67,092 |
| 2022 | $7,705 | $79,643 | $13,950 | $65,693 |
| 2021 | $7,136 | $72,885 | $13,950 | $58,935 |
| 2020 | $2,859 | $81,090 | $13,950 | $67,140 |
| 2019 | $9,012 | $81,090 | $13,950 | $67,140 |
| 2018 | $8,393 | $68,318 | $9,402 | $58,916 |
| 2017 | $6,481 | $63,259 | $10,056 | $53,203 |
| 2016 | $4,621 | $58,575 | $11,642 | $46,933 |
| 2015 | $176 | $58,501 | $13,950 | $44,551 |
| 2014 | $176 | $56,757 | $13,534 | $43,223 |
Source: Public Records
Map
Nearby Homes
- 3105 Emmons Ave Unit 1A
- 3105 Emmons Ave Unit 1C
- 3107 Emmons Ave Unit 2C
- 2839 Ford St
- 2800 Coyle St Unit 616
- 2800 Coyle St Unit 622
- 2841 Ford St Unit 1R
- 14A Mesereau Ct
- 2832 Brown St
- 2811 Haring St
- 3112 Emmons Ave Unit 3124-3
- 3112 Emmons Ave Unit 104
- 3112 Emmons Ave Unit 3120A-2
- 3112 Emmons Ave Unit 307
- 3165 Emmons Ave Unit 3
- 3165 Emmons Ave Unit 1L
- 3165 Emmons Ave Unit 3I
- 3136 Emmons Ave
- 7 Lake Ave
- 8 Lake Ave
- 2803 Batchelder St Unit 3C
- 2803 Batchelder St Unit 3B
- 2803 Batchelder St Unit 3A
- 2803 Batchelder St Unit 2C
- 2803 Batchelder St Unit 2B
- 2803 Batchelder St Unit 2A
- 2803 Batchelder St Unit 1C
- 2803 Batchelder St Unit 1A
- 2803 Batchelder St
- 2811 Batchelder St
- 2799 Batchelder St
- 2797 Batchelder St
- 2813 Batchelder St
- 2793 Batchelder St
- 2793 Batchelder St Unit 1st Fl
- 2817 Batchelder St
- 2808 Ford St
- 2810 Ford St
- 2800 Ford St
- 2812 Ford St