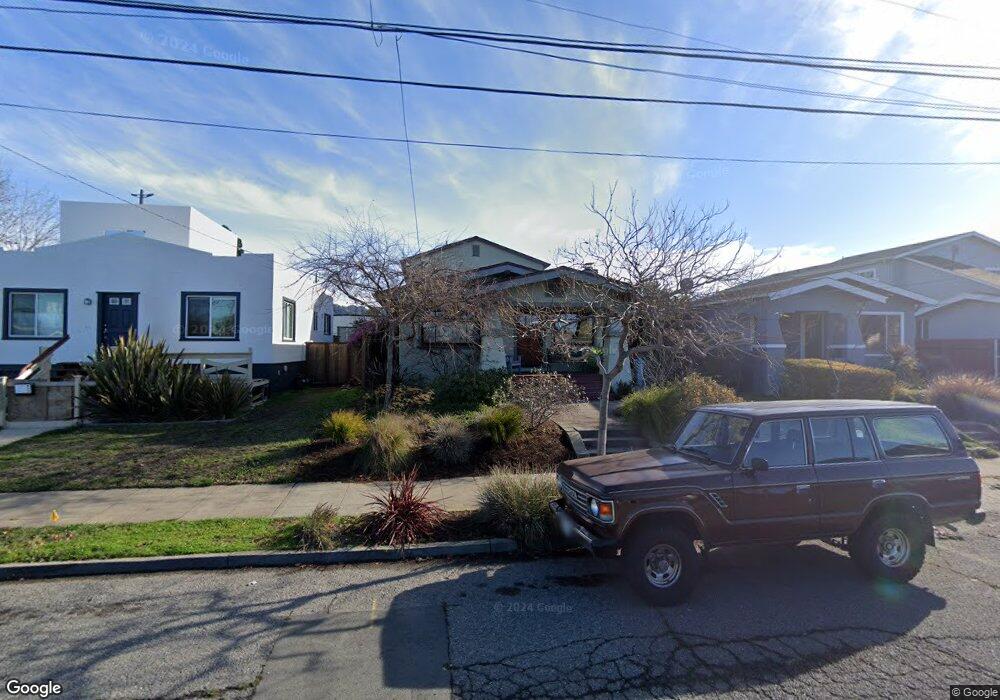
2803 Dohr St Berkeley, CA 94702
West Berkeley NeighborhoodEstimated Value: $1,352,172 - $1,578,000
3
Beds
3
Baths
1,839
Sq Ft
$785/Sq Ft
Est. Value
About This Home
This home is located at 2803 Dohr St, Berkeley, CA 94702 and is currently estimated at $1,443,543, approximately $784 per square foot. 2803 Dohr St is a home located in Alameda County with nearby schools including Malcolm X Elementary School, Washington Elementary School, and Oxford Elementary School.
Ownership History
Date
Name
Owned For
Owner Type
Purchase Details
Closed on
Jun 24, 2012
Sold by
1850 San Luis Llc
Bought by
Allard Duncan P and Zanfagna Christina M
Current Estimated Value
Home Financials for this Owner
Home Financials are based on the most recent Mortgage that was taken out on this home.
Original Mortgage
$468,000
Outstanding Balance
$322,968
Interest Rate
3.74%
Mortgage Type
New Conventional
Estimated Equity
$1,120,575
Purchase Details
Closed on
Mar 19, 2012
Sold by
Brown Sandra and Brown Raymond
Bought by
1850 San Luis Llc
Home Financials for this Owner
Home Financials are based on the most recent Mortgage that was taken out on this home.
Original Mortgage
$257,500
Interest Rate
3.83%
Mortgage Type
Purchase Money Mortgage
Create a Home Valuation Report for This Property
The Home Valuation Report is an in-depth analysis detailing your home's value as well as a comparison with similar homes in the area
Home Values in the Area
Average Home Value in this Area
Purchase History
| Date | Buyer | Sale Price | Title Company |
|---|---|---|---|
| Allard Duncan P | $585,000 | North American Title Company | |
| 1850 San Luis Llc | $305,000 | North American Title Company |
Source: Public Records
Mortgage History
| Date | Status | Borrower | Loan Amount |
|---|---|---|---|
| Open | Allard Duncan P | $468,000 | |
| Previous Owner | 1850 San Luis Llc | $257,500 |
Source: Public Records
Tax History
| Year | Tax Paid | Tax Assessment Tax Assessment Total Assessment is a certain percentage of the fair market value that is determined by local assessors to be the total taxable value of land and additions on the property. | Land | Improvement |
|---|---|---|---|---|
| 2025 | $11,487 | $734,753 | $220,426 | $514,327 |
| 2024 | $11,487 | $720,351 | $216,105 | $504,246 |
| 2023 | $11,247 | $706,228 | $211,868 | $494,360 |
| 2022 | $11,042 | $692,381 | $207,714 | $484,667 |
| 2021 | $11,066 | $678,810 | $203,643 | $475,167 |
| 2020 | $10,464 | $671,854 | $201,556 | $470,298 |
| 2019 | $10,044 | $658,685 | $197,605 | $461,080 |
| 2018 | $9,874 | $645,774 | $193,732 | $452,042 |
| 2017 | $9,522 | $633,115 | $189,934 | $443,181 |
| 2016 | $9,370 | $620,701 | $186,210 | $434,491 |
| 2015 | $9,089 | $611,383 | $183,415 | $427,968 |
| 2014 | $9,024 | $599,407 | $179,822 | $419,585 |
Source: Public Records
Map
Nearby Homes
- 2790 Sacramento St
- 2782 Sacramento St
- 2774 Sacramento St
- 2922 Stanton St
- 2758 Sacramento St
- 1450 Ward St
- 2750 Sacramento St
- 1535 Julia St
- 1314 Ashby Ave
- 2717 Mabel St
- 1515 Derby St
- 1507 Prince St
- 2751 Wallace St
- 1237 Ashby Ave
- 3032 Mabel St
- 3101 Sacramento St
- 1612 Carleton St
- 1646 Ashby Ave
- 3114 California St
- 1612 Parker St
Your Personal Tour Guide
Ask me questions while you tour the home.