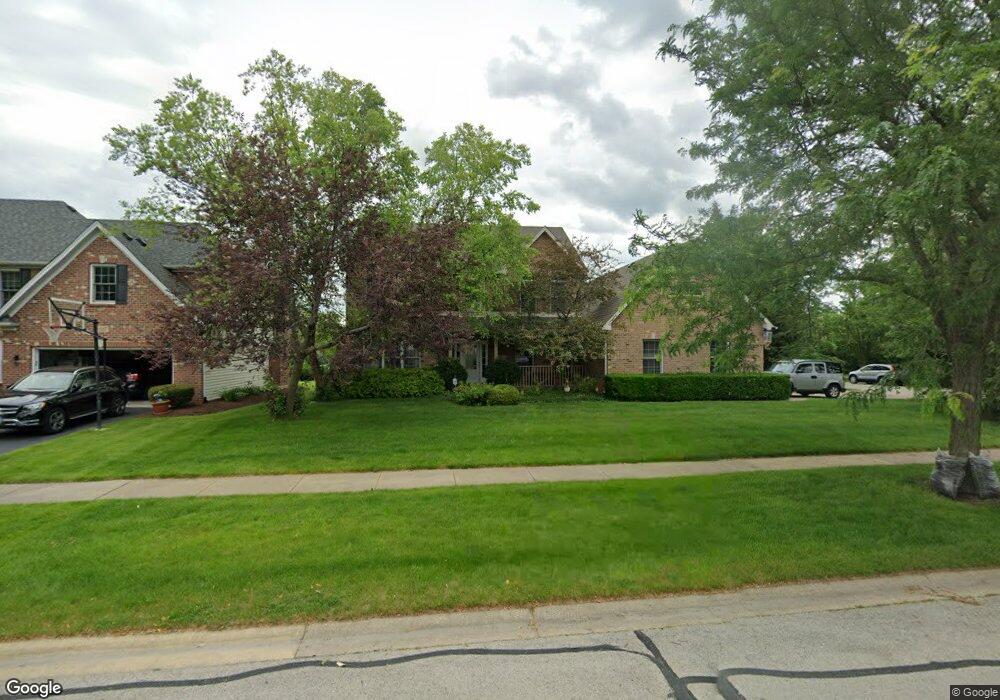
2803 Fairhauser Ct Unit 3 Naperville, IL 60564
Harmony Grove NeighborhoodEstimated Value: $693,824 - $829,000
4
Beds
4
Baths
2,728
Sq Ft
$271/Sq Ft
Est. Value
About This Home
This home is located at 2803 Fairhauser Ct Unit 3, Naperville, IL 60564 and is currently estimated at $739,206, approximately $270 per square foot. 2803 Fairhauser Ct Unit 3 is a home located in Will County with nearby schools including Oliver Julian Kendall Elementary School, Clifford Crone Middle School, and Neuqua Valley High School.
Ownership History
Date
Name
Owned For
Owner Type
Purchase Details
Closed on
Jan 24, 2011
Sold by
Rogers Ian and Rogers Elizabeth J
Bought by
Maloney John W and Maloney Jennifer S
Current Estimated Value
Home Financials for this Owner
Home Financials are based on the most recent Mortgage that was taken out on this home.
Original Mortgage
$328,000
Outstanding Balance
$224,367
Interest Rate
4.85%
Mortgage Type
New Conventional
Estimated Equity
$514,839
Purchase Details
Closed on
Aug 22, 2006
Sold by
Thornton Brian N and Thornton Julie
Bought by
Rogers Ian and Rogers Elizabeth J
Home Financials for this Owner
Home Financials are based on the most recent Mortgage that was taken out on this home.
Original Mortgage
$300,000
Interest Rate
6.7%
Mortgage Type
New Conventional
Purchase Details
Closed on
Feb 21, 2004
Sold by
Hepfinger Andrew J and Hepfinger Colleen A
Bought by
Thornton Brian and Thornton Julie
Home Financials for this Owner
Home Financials are based on the most recent Mortgage that was taken out on this home.
Original Mortgage
$336,000
Interest Rate
2.87%
Mortgage Type
Purchase Money Mortgage
Purchase Details
Closed on
Jun 28, 2000
Sold by
Hepfinger Andrew J
Bought by
Hepfinger Andrew J and Hepfinger Colleen A
Purchase Details
Closed on
Jan 28, 2000
Sold by
Faulkner Avery W and Faulkner Janet A
Bought by
Hepfinger Andrew J
Home Financials for this Owner
Home Financials are based on the most recent Mortgage that was taken out on this home.
Original Mortgage
$280,000
Interest Rate
7.98%
Purchase Details
Closed on
May 12, 1999
Sold by
Harris Bank Naperville
Bought by
Faulkner Avery W and Faulkner Janet A
Home Financials for this Owner
Home Financials are based on the most recent Mortgage that was taken out on this home.
Original Mortgage
$230,000
Interest Rate
7.04%
Purchase Details
Closed on
May 28, 1997
Sold by
Maf Developments Inc
Bought by
Harris Bank Naperville and Trust #5752
Home Financials for this Owner
Home Financials are based on the most recent Mortgage that was taken out on this home.
Original Mortgage
$45,750
Interest Rate
7.65%
Mortgage Type
Construction
Create a Home Valuation Report for This Property
The Home Valuation Report is an in-depth analysis detailing your home's value as well as a comparison with similar homes in the area
Home Values in the Area
Average Home Value in this Area
Purchase History
| Date | Buyer | Sale Price | Title Company |
|---|---|---|---|
| Maloney John W | $410,000 | None Available | |
| Rogers Ian | $508,500 | None Available | |
| Thornton Brian | $420,000 | Burnet Title Llc | |
| Hepfinger Andrew J | -- | -- | |
| Hepfinger Andrew J | $328,000 | -- | |
| Faulkner Avery W | $310,000 | -- | |
| Harris Bank Naperville | $61,000 | Chicago Title Insurance Co | |
| Westmore Builders Inc | $61,000 | Chicago Title Insurance Co |
Source: Public Records
Mortgage History
| Date | Status | Borrower | Loan Amount |
|---|---|---|---|
| Open | Maloney John W | $328,000 | |
| Previous Owner | Rogers Ian | $300,000 | |
| Previous Owner | Thornton Brian | $336,000 | |
| Previous Owner | Hepfinger Andrew J | $280,000 | |
| Previous Owner | Faulkner Avery W | $230,000 | |
| Previous Owner | Harris Bank Naperville | $45,750 |
Source: Public Records
Tax History
| Year | Tax Paid | Tax Assessment Tax Assessment Total Assessment is a certain percentage of the fair market value that is determined by local assessors to be the total taxable value of land and additions on the property. | Land | Improvement |
|---|---|---|---|---|
| 2024 | $12,304 | $195,849 | $43,748 | $152,101 |
| 2023 | $12,304 | $173,012 | $38,647 | $134,365 |
| 2022 | $11,066 | $158,742 | $36,560 | $122,182 |
| 2021 | $10,575 | $151,183 | $34,819 | $116,364 |
| 2020 | $10,374 | $148,787 | $34,267 | $114,520 |
| 2019 | $10,195 | $144,594 | $33,301 | $111,293 |
| 2018 | $9,595 | $134,087 | $32,568 | $101,519 |
| 2017 | $10,790 | $148,353 | $31,727 | $116,626 |
| 2016 | $10,770 | $145,159 | $31,044 | $114,115 |
| 2015 | $10,858 | $139,576 | $29,850 | $109,726 |
| 2014 | $10,858 | $135,836 | $29,850 | $105,986 |
| 2013 | $10,858 | $135,836 | $29,850 | $105,986 |
Source: Public Records
Map
Nearby Homes
- 2836 Fairhauser Ct
- 11330 Highland Dr S
- 12021 S Stallion Dr
- 23234 W Allagash Dr
- 11300 Highland Dr S
- 24050 W Champion Dr
- 2511 Wild Timothy Rd
- 4711 Snapjack Cir
- 3712 Ryder Ct
- 24430 Boulevard de John
- 2547 Mallet Ct
- 2543 Mallet Ct
- 2519 Mallet Ct
- 2255 Wendt Cir
- 2611 Lawlor Ln
- 2515 Mallet Ct
- 2607 Lawlor Ln
- 2419 Lawlor Ln
- 2423 Lawlor Ln
- 2427 Lawlor Ln
- 2807 Fairhauser Ct Unit 3
- 4707 Niswender Dr Unit 3
- 2743 Fairhauser Rd
- 2815 Fairhauser Ct
- 4703 Niswender Dr
- 2839 Fairhauser Ct
- 2804 Fairhauser Ct
- 2744 Wait Rd Unit 3
- 2744 Fairhauser Rd Unit 3
- 2843 Fairhauser Ct
- 2812 Fairhauser Ct
- 2739 Fairhauser Rd
- 4623 Niswender Ct
- 2740 Fairhauser Rd
- 2740 Wait Rd Unit 3
- 2816 Fairhauser Ct
- 2847 Fairhauser Ct
- 2735 Fairhauser Rd
- 2735 Hassert Blvd
Your Personal Tour Guide
Ask me questions while you tour the home.