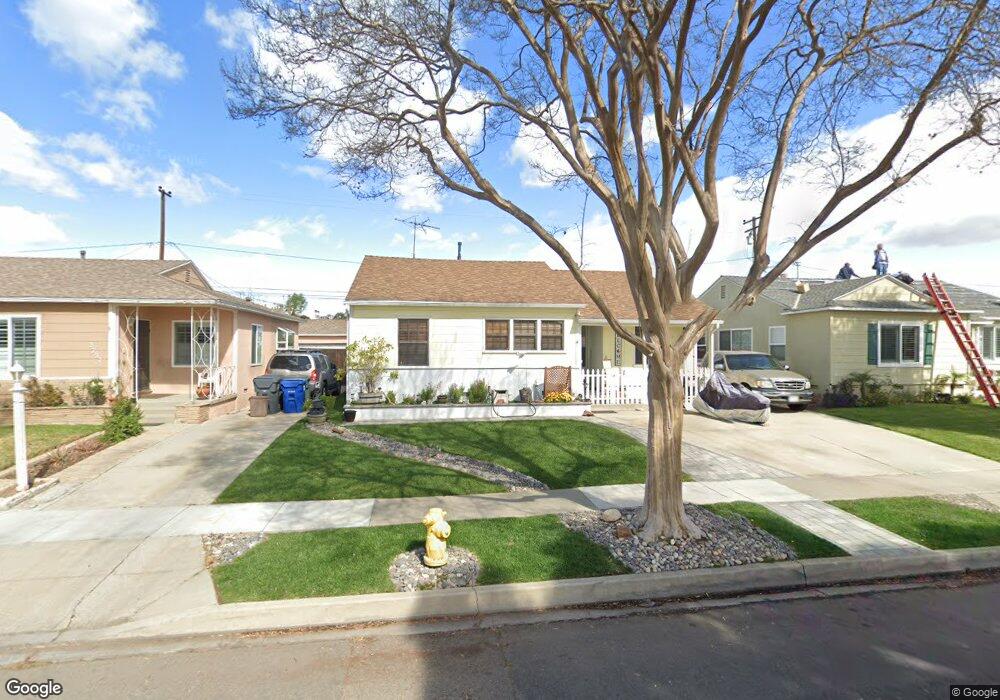
2803 Harvey Way Lakewood, CA 90712
Lakewood Mutual NeighborhoodEstimated Value: $811,493 - $870,000
3
Beds
2
Baths
1,318
Sq Ft
$630/Sq Ft
Est. Value
About This Home
This home is located at 2803 Harvey Way, Lakewood, CA 90712 and is currently estimated at $830,373, approximately $630 per square foot. 2803 Harvey Way is a home located in Los Angeles County with nearby schools including James Madison Elementary School, Hoover Middle School, and Lakewood High School.
Ownership History
Date
Name
Owned For
Owner Type
Purchase Details
Closed on
Feb 7, 2007
Sold by
Brand Shirley M
Bought by
Brand Michael L and Brand Shirley M
Current Estimated Value
Purchase Details
Closed on
Dec 30, 1999
Sold by
Peterson Alwyn B
Bought by
Orthel Shirley M
Purchase Details
Closed on
Oct 27, 1995
Sold by
Ourtel Shirley Mae
Bought by
Orthel Shirley Mae and Peterson Alwyn B
Home Financials for this Owner
Home Financials are based on the most recent Mortgage that was taken out on this home.
Original Mortgage
$72,000
Interest Rate
7.58%
Purchase Details
Closed on
Aug 28, 1995
Sold by
Orthel Shirley M
Bought by
Orthel Shirley M and Peterson Alwyn B
Home Financials for this Owner
Home Financials are based on the most recent Mortgage that was taken out on this home.
Original Mortgage
$72,000
Interest Rate
7.58%
Purchase Details
Closed on
Aug 17, 1995
Sold by
Orthel James L
Bought by
Orthel Shirley M
Create a Home Valuation Report for This Property
The Home Valuation Report is an in-depth analysis detailing your home's value as well as a comparison with similar homes in the area
Home Values in the Area
Average Home Value in this Area
Purchase History
| Date | Buyer | Sale Price | Title Company |
|---|---|---|---|
| Brand Michael L | -- | None Available | |
| Brand Shirley M | -- | None Available | |
| Orthel Shirley M | -- | -- | |
| Orthel Shirley Mae | -- | Old Republic Title Company | |
| Orthel Shirley M | -- | -- | |
| Orthel Shirley M | -- | Old Republic Title Company |
Source: Public Records
Mortgage History
| Date | Status | Borrower | Loan Amount |
|---|---|---|---|
| Previous Owner | Orthel Shirley Mae | $72,000 |
Source: Public Records
Tax History Compared to Growth
Tax History
| Year | Tax Paid | Tax Assessment Tax Assessment Total Assessment is a certain percentage of the fair market value that is determined by local assessors to be the total taxable value of land and additions on the property. | Land | Improvement |
|---|---|---|---|---|
| 2025 | $2,850 | $191,535 | $115,445 | $76,090 |
| 2024 | $2,850 | $187,781 | $113,182 | $74,599 |
| 2023 | $2,800 | $184,100 | $110,963 | $73,137 |
| 2022 | $2,643 | $180,491 | $108,788 | $71,703 |
| 2021 | $2,583 | $176,953 | $106,655 | $70,298 |
| 2019 | $2,543 | $171,707 | $103,493 | $68,214 |
| 2018 | $2,405 | $168,341 | $101,464 | $66,877 |
| 2016 | $2,212 | $161,806 | $97,525 | $64,281 |
| 2015 | $2,133 | $159,377 | $96,061 | $63,316 |
| 2014 | $2,123 | $156,256 | $94,180 | $62,076 |
Source: Public Records
Map
Nearby Homes
- 2729 Greentop St
- 2803 Frankel St
- 4559 Levelside Ave
- 4328 Deeboyar Ave
- 3244 Centralia St
- 2912 Allred St
- 4700 Clair Del Ave Unit 538
- 2523 Allred St
- 3638 Sandwood St
- 4121 Country Club Dr
- 2922 Eckleson St
- 4425 Walnut Ave
- 2912 Yearling St
- 3829 Cherry Ave
- 4251 Gundry Ave
- 2739 Denmead St
- 4944 Coke Ave
- 4520 Pepperwood Ave
- 4532 Pepperwood Ave
- 4848 Oliva Ave
- 2807 Harvey Way
- 2737 Harvey Way
- 2813 Harvey Way
- 2733 Harvey Way
- 2742 Flangel St
- 2738 Flangel St
- 2802 Flangel St
- 2732 Flangel St
- 2808 Flangel St
- 2817 Harvey Way
- 2727 Harvey Way
- 2804 Harvey Way
- 2740 Harvey Way
- 2810 Harvey Way
- 2734 Harvey Way
- 2728 Flangel St
- 2812 Flangel St
- 2814 Harvey Way
- 2823 Harvey Way
- 2723 Harvey Way