Estimated Value: $630,000 - $719,000
5
Beds
5
Baths
4,059
Sq Ft
$168/Sq Ft
Est. Value
About This Home
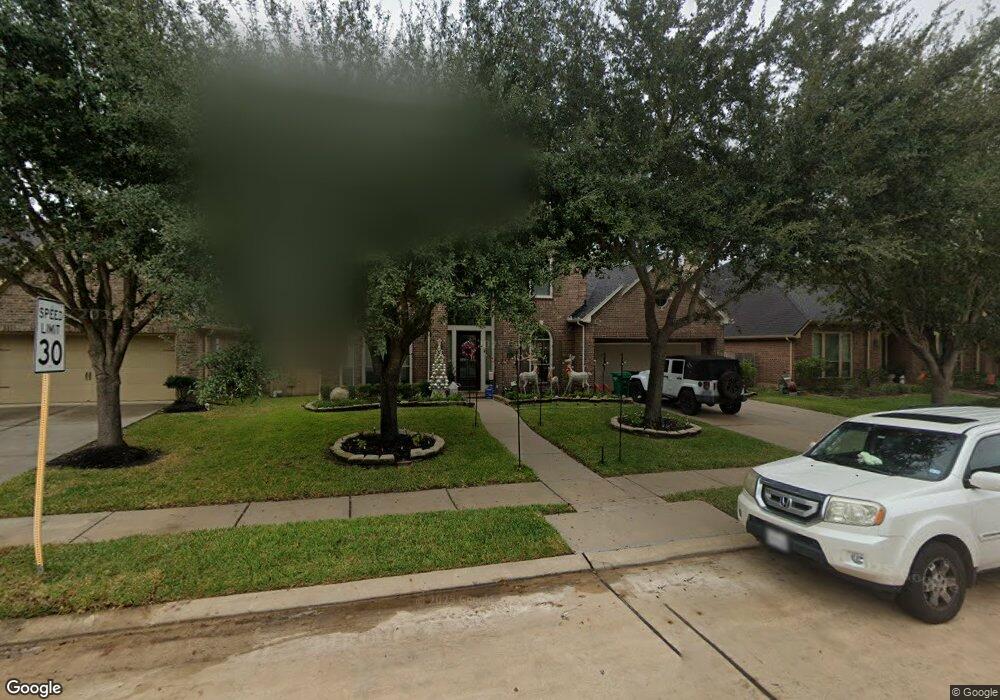
This home is located at 2803 Texas Laurel Dr, Katy, TX 77494 and is currently estimated at $683,891, approximately $168 per square foot. 2803 Texas Laurel Dr is a home located in Fort Bend County with nearby schools including Ray And Jamie Wolman Elementary School, Woodcreek Junior High School, and Katy High School.
Ownership History
Date
Name
Owned For
Owner Type
Purchase Details
Closed on
Apr 24, 2014
Sold by
Cartus Financial Corp
Bought by
Johnson Chad D
Current Estimated Value
Home Financials for this Owner
Home Financials are based on the most recent Mortgage that was taken out on this home.
Original Mortgage
$379,000
Outstanding Balance
$289,408
Interest Rate
4.46%
Mortgage Type
New Conventional
Estimated Equity
$394,483
Purchase Details
Closed on
Jan 2, 2014
Sold by
Echegaray Adolfo G
Bought by
Cartus Financial Corp
Purchase Details
Closed on
Jun 18, 2010
Sold by
Perry Homes Llc
Bought by
Echegaray Adolfo G and Echegaray Patricia
Home Financials for this Owner
Home Financials are based on the most recent Mortgage that was taken out on this home.
Original Mortgage
$323,635
Interest Rate
4.81%
Mortgage Type
New Conventional
Create a Home Valuation Report for This Property
The Home Valuation Report is an in-depth analysis detailing your home's value as well as a comparison with similar homes in the area
Home Values in the Area
Average Home Value in this Area
Purchase History
| Date | Buyer | Sale Price | Title Company |
|---|---|---|---|
| Johnson Chad D | -- | Closing Title Co | |
| Cartus Financial Corp | -- | Texas American Title Co | |
| Johnson Chad D | -- | -- | |
| Echegaray Adolfo G | -- | Chicago Title | |
| Johnson Chad D | -- | -- |
Source: Public Records
Mortgage History
| Date | Status | Borrower | Loan Amount |
|---|---|---|---|
| Open | Johnson Chad D | $379,000 | |
| Previous Owner | Johnson Chad D | $323,635 | |
| Previous Owner | Johnson Chad D | $323,900 |
Source: Public Records
Tax History Compared to Growth
Tax History
| Year | Tax Paid | Tax Assessment Tax Assessment Total Assessment is a certain percentage of the fair market value that is determined by local assessors to be the total taxable value of land and additions on the property. | Land | Improvement |
|---|---|---|---|---|
| 2025 | $12,330 | $661,906 | $97,240 | $592,714 |
| 2024 | $12,330 | $601,733 | -- | $606,676 |
| 2023 | $11,410 | $547,030 | $0 | $620,479 |
| 2022 | $11,989 | $497,300 | $0 | $517,250 |
| 2021 | $11,242 | $417,210 | $74,800 | $342,410 |
| 2020 | $11,037 | $403,990 | $68,000 | $335,990 |
| 2019 | $10,910 | $372,290 | $65,000 | $307,290 |
| 2018 | $11,542 | $390,500 | $65,000 | $325,500 |
| 2017 | $11,458 | $383,150 | $65,000 | $318,150 |
| 2016 | $12,359 | $413,260 | $65,000 | $348,260 |
| 2015 | $7,764 | $427,370 | $65,000 | $362,370 |
| 2014 | $7,071 | $379,710 | $65,000 | $314,710 |
Source: Public Records
Map
Nearby Homes
- 28514 Rock Wren Ct
- 28514 Blue Holly Ln
- 28622 Blue Holly Ln
- 2851 Park Hills Dr
- 28814 Davenport Dr
- 2506 Foxcrest Dr
- 28915 Davenport Dr
- 2827 Fair Chase Dr
- 28514 Hayden Park Dr
- 28514 Eli Eagle St
- 28407 Kinglet Pines Dr
- 2907 Isla Gorge Ct
- 28226 S Firethorne Rd
- 28434 Eli Eagle St
- 2843 Mcdonough Way
- 28523 Chesley Park Dr
- 28919 Crested Butte Dr
- 28511 Eli Eagle St
- 28918 Hollycrest Dr
- 2818 Mcdonough Way
- 2719 Texas Laurel Dr
- 2807 Texas Laurel Dr
- 28515 Rock Wren Ct
- 2715 Texas Laurel Dr
- 2811 Texas Laurel Dr
- 2802 Texas Laurel Dr
- 2718 Texas Laurel Dr
- 2815 Texas Laurel Dr
- 2806 Texas Laurel Dr
- 2711 Texas Laurel Dr
- 28511 Rock Wren Ct
- 2714 Texas Laurel Dr
- 28510 Woodlark Dr
- 2810 Texas Laurel Dr
- 28510 Rock Wren Ct
- 2710 Texas Laurel Dr
- 2819 Texas Laurel Dr
- 2707 Texas Laurel Dr
- 28514 Woodlark Dr
- 28507 Rock Wren Ct