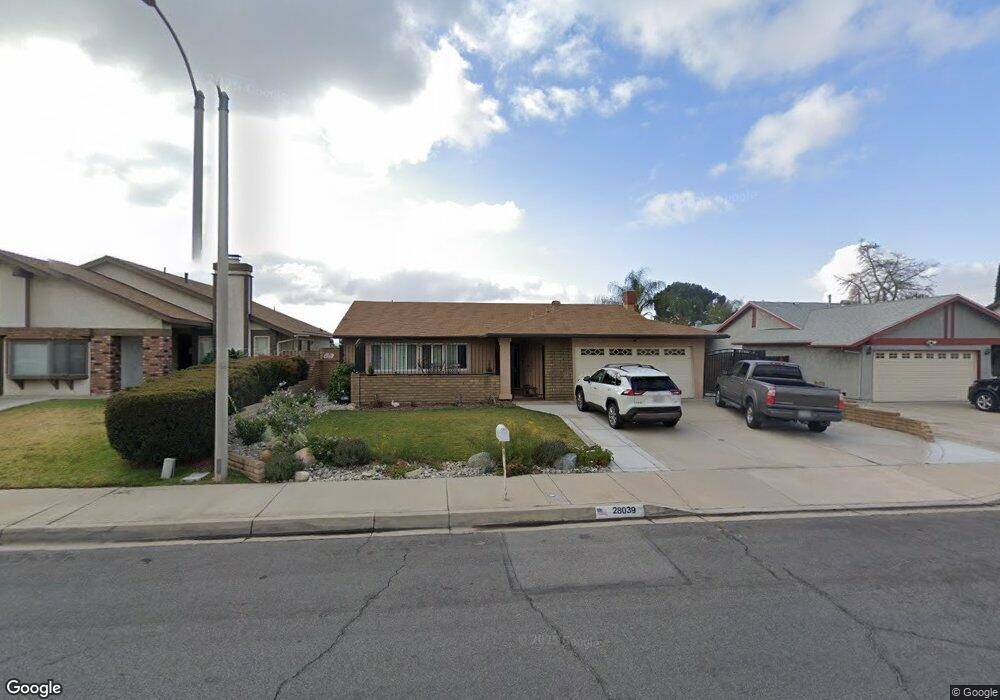
28039 Pacific St Highland, CA 92346
East Highlands NeighborhoodEstimated Value: $507,670 - $570,000
3
Beds
2
Baths
1,470
Sq Ft
$372/Sq Ft
Est. Value
About This Home
This home is located at 28039 Pacific St, Highland, CA 92346 and is currently estimated at $547,168, approximately $372 per square foot. 28039 Pacific St is a home located in San Bernardino County with nearby schools including Thompson Elementary School, Serrano Middle School, and San Gorgonio High School.
Ownership History
Date
Name
Owned For
Owner Type
Purchase Details
Closed on
Aug 25, 2021
Sold by
Thomas Earl W and Thigpen Stephanie L
Bought by
Thomas Earl W and Thigpen Stephanie L
Current Estimated Value
Home Financials for this Owner
Home Financials are based on the most recent Mortgage that was taken out on this home.
Original Mortgage
$250,000
Outstanding Balance
$227,481
Interest Rate
2.8%
Mortgage Type
New Conventional
Estimated Equity
$319,687
Purchase Details
Closed on
Oct 13, 2017
Sold by
Thomas Earl W
Bought by
Thomas Earl W and Thigpen Thomas Stephanie L
Purchase Details
Closed on
Oct 27, 1999
Sold by
Hutchins Jeffrey A
Bought by
Thomas Earl W
Home Financials for this Owner
Home Financials are based on the most recent Mortgage that was taken out on this home.
Original Mortgage
$122,811
Interest Rate
7.96%
Mortgage Type
FHA
Create a Home Valuation Report for This Property
The Home Valuation Report is an in-depth analysis detailing your home's value as well as a comparison with similar homes in the area
Home Values in the Area
Average Home Value in this Area
Purchase History
| Date | Buyer | Sale Price | Title Company |
|---|---|---|---|
| Thomas Earl W | -- | Priority Title | |
| Thomas Earl W | -- | None Available | |
| Thomas Earl W | -- | None Available | |
| Thomas Earl W | $123,000 | Commonwealth Land Title Co |
Source: Public Records
Mortgage History
| Date | Status | Borrower | Loan Amount |
|---|---|---|---|
| Open | Thomas Earl W | $250,000 | |
| Previous Owner | Thomas Earl W | $122,811 |
Source: Public Records
Tax History
| Year | Tax Paid | Tax Assessment Tax Assessment Total Assessment is a certain percentage of the fair market value that is determined by local assessors to be the total taxable value of land and additions on the property. | Land | Improvement |
|---|---|---|---|---|
| 2025 | $2,727 | $189,055 | $47,266 | $141,789 |
| 2024 | $2,669 | $185,348 | $46,339 | $139,009 |
| 2023 | $2,612 | $181,713 | $45,430 | $136,283 |
| 2022 | $2,609 | $178,150 | $44,539 | $133,611 |
| 2021 | $2,661 | $174,657 | $43,666 | $130,991 |
| 2020 | $2,654 | $172,866 | $43,218 | $129,648 |
| 2019 | $2,564 | $169,477 | $42,371 | $127,106 |
| 2018 | $2,471 | $166,154 | $41,540 | $124,614 |
| 2017 | $2,151 | $162,896 | $40,725 | $122,171 |
| 2016 | $2,088 | $159,701 | $39,926 | $119,775 |
| 2015 | $2,127 | $157,302 | $39,326 | $117,976 |
| 2014 | $2,069 | $154,221 | $38,556 | $115,665 |
Source: Public Records
Map
Nearby Homes
- 6959 Grove Ave
- 28005 Nona Ave
- 28261 Cornus Ct
- 6886 Country Oaks Dr
- 6632 Summertrail Place
- 1614 Buckeye St
- 7079 Cienega Dr
- 0 Baseline St Unit CV25136921
- 27631 Villa Ave
- 7001 Church Ave Unit 15
- 27611 Villa Ave
- 27540 14th St
- 6986 Church Ave
- 0 La Praix St
- 0 Boulder Ave Unit RS26051330
- 6984 Bradford Ave
- 7471 Dunkirk Ave
- 6927 Gala St
- 0 Gala St
- 3850 Atlantic Ave Unit 66
- 28049 Pacific St
- 28029 Pacific St
- 6935 Oleander Ave
- 28059 Pacific St
- 28019 Pacific St
- 6936 Oleander Ave
- 6943 Oleander Ave
- 28034 Pacific St
- 28044 Pacific St
- 28009 Pacific St
- 28067 Pacific St
- 28024 Pacific St
- 6926 Grove Ave
- 6942 Oleander Ave
- 28054 Pacific St
- 28012 Pacific St
- 6936 Grove Ave
- 6949 Oleander Ave
- 27999 Pacific St
- 28064 Pacific St
Your Personal Tour Guide
Ask me questions while you tour the home.