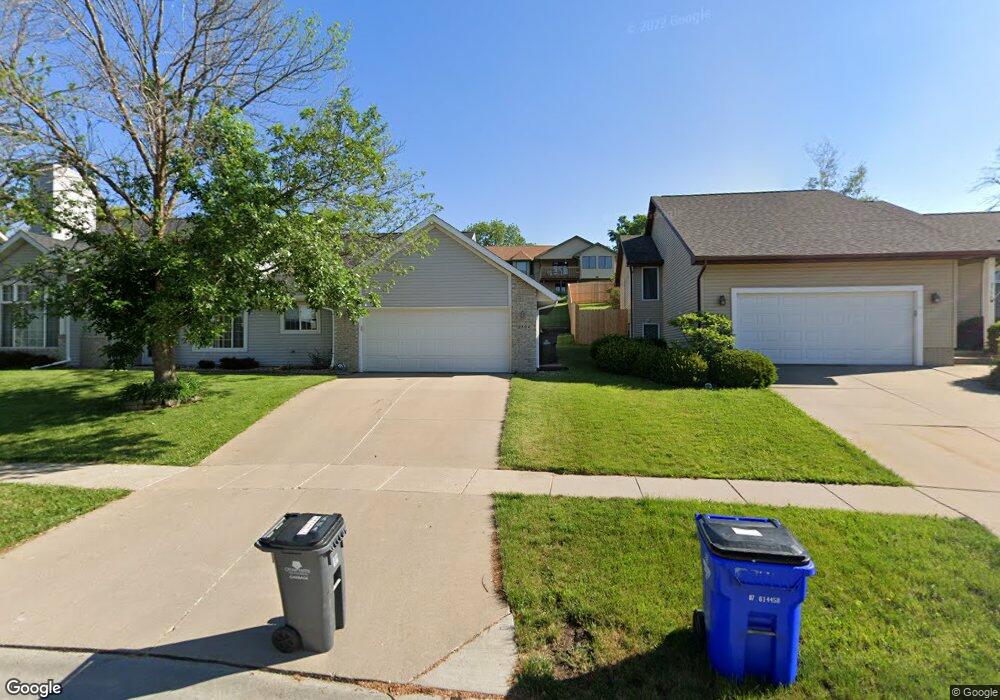
2804 Camelot Ave NW Cedar Rapids, IA 52405
Estimated Value: $271,804 - $311,000
3
Beds
2
Baths
1,688
Sq Ft
$173/Sq Ft
Est. Value
About This Home
This home is located at 2804 Camelot Ave NW, Cedar Rapids, IA 52405 and is currently estimated at $291,201, approximately $172 per square foot. 2804 Camelot Ave NW is a home located in Linn County with nearby schools including Kentucky Tech - Ashland Reg Tech Center, Ponderosa Elementary School, and Madison Elementary School.
Ownership History
Date
Name
Owned For
Owner Type
Purchase Details
Closed on
Aug 9, 2013
Sold by
Sandler Leigh A
Bought by
Schrader Kaitlyn E
Current Estimated Value
Home Financials for this Owner
Home Financials are based on the most recent Mortgage that was taken out on this home.
Original Mortgage
$177,500
Outstanding Balance
$132,735
Interest Rate
4.53%
Mortgage Type
Future Advance Clause Open End Mortgage
Estimated Equity
$158,466
Purchase Details
Closed on
Jun 27, 2012
Sold by
Sandler Ronald N
Bought by
Sandler Leigh A
Home Financials for this Owner
Home Financials are based on the most recent Mortgage that was taken out on this home.
Original Mortgage
$166,250
Interest Rate
3.83%
Mortgage Type
New Conventional
Create a Home Valuation Report for This Property
The Home Valuation Report is an in-depth analysis detailing your home's value as well as a comparison with similar homes in the area
Home Values in the Area
Average Home Value in this Area
Purchase History
| Date | Buyer | Sale Price | Title Company |
|---|---|---|---|
| Schrader Kaitlyn E | $173,000 | None Available | |
| Sandler Leigh A | -- | Security First Title Co | |
| Sandler Leigh A | -- | None Available |
Source: Public Records
Mortgage History
| Date | Status | Borrower | Loan Amount |
|---|---|---|---|
| Open | Schrader Kaitlyn E | $177,500 | |
| Previous Owner | Sandler Leigh A | $166,250 |
Source: Public Records
Tax History Compared to Growth
Tax History
| Year | Tax Paid | Tax Assessment Tax Assessment Total Assessment is a certain percentage of the fair market value that is determined by local assessors to be the total taxable value of land and additions on the property. | Land | Improvement |
|---|---|---|---|---|
| 2025 | $3,874 | $266,500 | $59,800 | $206,700 |
| 2024 | $4,196 | $238,600 | $55,700 | $182,900 |
| 2023 | $4,196 | $218,900 | $51,600 | $167,300 |
| 2022 | $4,120 | $198,900 | $43,300 | $155,600 |
| 2021 | $4,290 | $198,900 | $43,300 | $155,600 |
| 2020 | $4,290 | $194,400 | $33,000 | $161,400 |
| 2019 | $3,970 | $184,200 | $33,000 | $151,200 |
| 2018 | $3,860 | $184,200 | $33,000 | $151,200 |
| 2017 | $3,700 | $177,200 | $33,000 | $144,200 |
| 2016 | $3,700 | $174,100 | $33,000 | $141,100 |
| 2015 | $3,654 | $171,728 | $32,995 | $138,733 |
| 2014 | $3,654 | $165,200 | $32,995 | $132,205 |
| 2013 | $3,254 | $165,200 | $32,995 | $132,205 |
Source: Public Records
Map
Nearby Homes
- 912 29th St NW
- 2623 Iris Ave NW
- 623 27th St NW
- 615 27th St NW
- 425 28th St NW
- 949 Westwood Dr NW
- 3312 G Ave NW
- 451 23rd St NW
- 1322 Woodside Dr NW
- 1410 Adair Ct SW Unit Lot 2
- 3313 Crestwood Dr NW
- 327 NW Edgewood Rd Unit 324, 330, 336, 342 C
- 2825 Schultz Dr NW
- 2801 Schultz Dr NW
- 312 24th Ave NW
- 3507 E Ave NW Unit F
- 3509 E Ave NW Unit D
- 3107 Johnson Ave NW Unit 4
- 232 27th St NW
- 225 31st St NW
- 2814 Camelot Ave NW
- 2720 Camelot Ave NW
- 2807 Lancelot Ln NW
- 2719 Lancelot Ln NW
- 2817 Lancelot Ln NW
- 2832 Camelot Ave NW
- 2713 Lancelot Ln NW
- 2710 Camelot Ave NW
- 2813 Camelot Ave NW
- 911 29th St NW
- 2803 Camelot Ave NW
- 811 29th St NW
- 2707 Lancelot Ln NW
- 2704 Camelot Ave NW
- 2719 Camelot Ave NW
- 2806 Lancelot Ln NW
- 2718 Lancelot Ln NW
- 2816 Lancelot Ln NW
- 2610 Camelot Ave NW
- 900 29th St NW