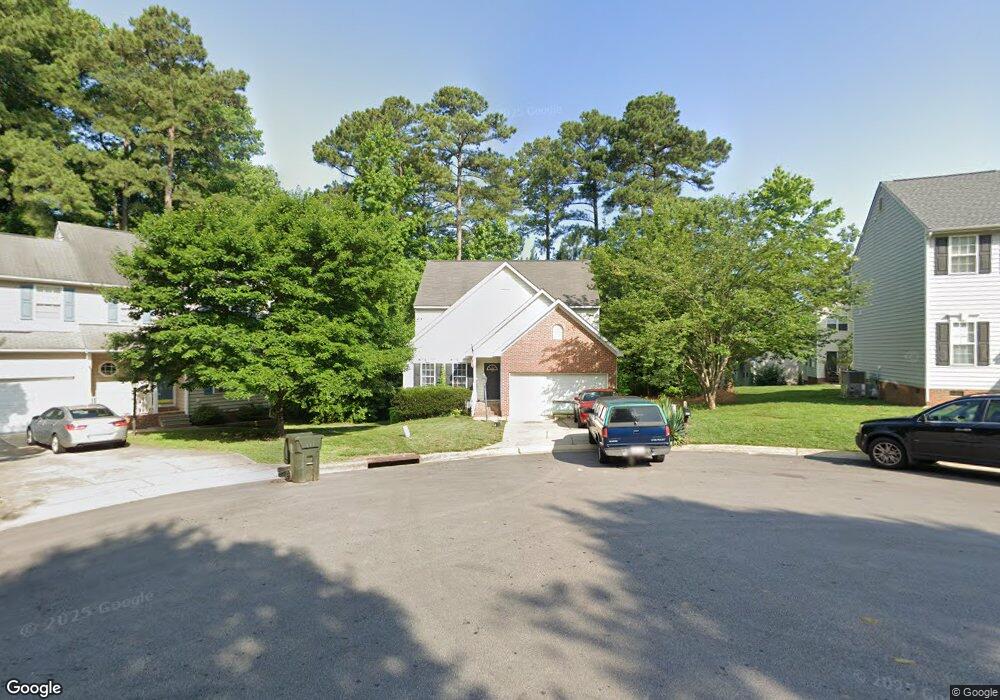
2804 Lower Dry Falls Ct Raleigh, NC 27603
South Raleigh NeighborhoodEstimated Value: $436,510 - $462,000
4
Beds
3
Baths
1,897
Sq Ft
$237/Sq Ft
Est. Value
About This Home
This home is located at 2804 Lower Dry Falls Ct, Raleigh, NC 27603 and is currently estimated at $449,628, approximately $237 per square foot. 2804 Lower Dry Falls Ct is a home located in Wake County with nearby schools including Dillard Drive Magnet Elementary School, Dillard Drive Magnet Middle School, and Longleaf School Of The Arts.
Ownership History
Date
Name
Owned For
Owner Type
Purchase Details
Closed on
May 26, 2005
Sold by
Malan Charles Christian Ralph and Van De Schyff Shafieka
Bought by
Hall Jeffrey R
Current Estimated Value
Home Financials for this Owner
Home Financials are based on the most recent Mortgage that was taken out on this home.
Original Mortgage
$150,950
Outstanding Balance
$84,350
Interest Rate
6.87%
Mortgage Type
Fannie Mae Freddie Mac
Estimated Equity
$365,278
Purchase Details
Closed on
Jun 28, 2001
Sold by
Horizon Homes Inc
Bought by
Malan Charles Christian Ralph and Vandeschyff Shafieka
Home Financials for this Owner
Home Financials are based on the most recent Mortgage that was taken out on this home.
Original Mortgage
$166,952
Interest Rate
7.14%
Mortgage Type
FHA
Purchase Details
Closed on
Mar 20, 2001
Sold by
Lineberry Associates Lmtd Prtnshp
Bought by
Horizon Homes Inc
Home Financials for this Owner
Home Financials are based on the most recent Mortgage that was taken out on this home.
Original Mortgage
$27,200
Interest Rate
7.02%
Mortgage Type
Construction
Create a Home Valuation Report for This Property
The Home Valuation Report is an in-depth analysis detailing your home's value as well as a comparison with similar homes in the area
Home Values in the Area
Average Home Value in this Area
Purchase History
| Date | Buyer | Sale Price | Title Company |
|---|---|---|---|
| Hall Jeffrey R | $189,000 | -- | |
| Malan Charles Christian Ralph | $168,500 | -- | |
| Horizon Homes Inc | $30,500 | -- |
Source: Public Records
Mortgage History
| Date | Status | Borrower | Loan Amount |
|---|---|---|---|
| Open | Hall Jeffrey R | $150,950 | |
| Closed | Hall Jeffrey R | $37,500 | |
| Previous Owner | Malan Charles Christian Ralph | $166,952 | |
| Previous Owner | Horizon Homes Inc | $27,200 |
Source: Public Records
Tax History Compared to Growth
Tax History
| Year | Tax Paid | Tax Assessment Tax Assessment Total Assessment is a certain percentage of the fair market value that is determined by local assessors to be the total taxable value of land and additions on the property. | Land | Improvement |
|---|---|---|---|---|
| 2025 | $4,017 | $458,356 | $160,000 | $298,356 |
| 2024 | $4,001 | $458,356 | $160,000 | $298,356 |
| 2023 | $3,298 | $300,700 | $60,000 | $240,700 |
| 2022 | $3,065 | $300,700 | $60,000 | $240,700 |
| 2021 | $2,946 | $300,700 | $60,000 | $240,700 |
| 2020 | $2,892 | $300,700 | $60,000 | $240,700 |
| 2019 | $2,520 | $215,727 | $54,000 | $161,727 |
| 2018 | $2,377 | $215,727 | $54,000 | $161,727 |
| 2017 | $2,264 | $215,727 | $54,000 | $161,727 |
| 2016 | $2,218 | $215,727 | $54,000 | $161,727 |
| 2015 | $2,206 | $211,123 | $48,000 | $163,123 |
| 2014 | $2,093 | $211,123 | $48,000 | $163,123 |
Source: Public Records
Map
Nearby Homes
- 2816 Alder Ridge Ln
- 2901 Alder Ridge Ln
- 2505 Ferndown Ct
- 2639 Broad Oaks Place Unit 21
- 2524 Ferndown Ct
- 2528 Beech Gap Ct
- 2607 Sterling Park Dr
- 2621 Ivory Run Way Unit 105
- 2636 Scattered Oak Ct
- 2201 Mountain Mist Ct Unit 103
- 2221 Mountain Mist Ct Unit 201
- 2831 Barrymore St Unit 107
- 3113 Henslowe Dr
- 2271 Trailwood Valley Cir
- 2920 Barrymore St Unit 106
- 2108 Leadenhall Way
- 3109 Tryon Rd
- 3113 Tryon Rd
- 3115 Tryon Rd
- 1901 Trailwood Heights Ln Unit 304
- 2808 Lower Dry Falls Ct
- 2800 Lower Dry Falls Ct
- 2805 Alder Ridge Ln
- 2800 Lower Dryer Falls Ct
- 2809 Alder Ridge Ln
- 2604 Farlow Gap Ln
- 2809 Lower Dryer Falls Ct
- 2809 Lower Dry Falls Ct
- 2600 Farlow Gap Ln
- 2813 Alder Ridge Ln
- 2805 Lower Dry Falls Ct
- 2801 Lower Dry Falls Ct
- 2617 Farlow Gap Ln
- 2605 Farlow Gap Ln
- 2817 Alder Ridge Ln
- 2804 Alder Ridge Ln
- 2601 Farlow Gap Ln
- 2621 Farlow Gap Ln
- 2520 Farlow Gap Ln
- 2800 Alder Ridge Ln